👋 Welcome
Welcome to the Hydro Learning Adventure! Click "Next" to begin your journey.
💧 Welcome to the World of Hydro Energy!
Imagine using the force of flowing water to generate electricity. That’s exactly what hydropower does — using turbines to transform the energy of water into clean, renewable power.
In this workbook, you’ll dive into the fascinating world of hydropower: how it works, why it matters, and how it can help build a more sustainable future.
🌱 Why Learn About Hydro Energy?
With climate change and limited fossil fuels, hydropower plays a key role in creating clean, reliable energy. It reduces emissions, protects ecosystems, and offers powerful solutions for the future.
📘 What You’ll Learn
- Hydropower Basics: Where water energy comes from and how we can use it
- Water Wheels: How they work and how to improve their performance
- Modern turbines: Why different turbines exist and when each type is used
- Water Behavior: How height, flow, and speed influence energy generation
- Renewable energy comparison: How hydro differs form solar and wind
- Grid concepts: How energy supply and demand are balanced (base load vs. peak load)
🔍 How It Works
This workbook combines explanations, experiments, and activities to help you explore hydropower from both scientific and practical perspectives.
🌊 Get Ready to Flow
By the end of this workbook, you’ll understand how hydropower works and why it’s important for a cleaner, greener future.
You’ll gain tools and knowledge to explore real-world energy solutions — and help shape a brighter tomorrow.
📘 Key Hydropower Terms
Use this glossary to understand important terms you’ll encounter throughout your hydro learning journey.
🌊 Why is Hydropower Important?
When talking about hydropower, we are referring to the energy gained from water sources.
This energy comes from the force created by the movement of water.
Hydropower plays a key role in today’s energy system because it is renewable,
reliable, and climate-friendly.
Here are the most important reasons why hydropower matters:
✅ Key Advantages of Hydropower
-
Renewable Energy Source:
Hydropower depends on the water cycle, which is powered by the sun.
As long as rivers flow and rain falls, we can produce hydropower again and again. -
Environmentally Friendly:
During operation, hydropower produces almost no greenhouse gas emissions.
Over its lifetime, hydropower usually causes around 95% lower greenhouse gas emissions than coal power. -
Reliable and Consistent Energy Source:
Unlike solar or wind power, which depend on fluctuating weather conditions, hydropower plants can produce energy consistently.
Hydropower can run day and night, all year, because water can be stored and released when needed. -
Energy Storage Capability:
Some hydropower plants can act like giant batteries.
When there is low demand and/or excess electricity, they can pump water to an elevated place and release it when demand is rising.
This capability can also be used to balance supply and demand. -
Long-Term Domestic Source of Energy:
Hydropower’s “fuel” is water, and it uses local water resources.
Countries with good geographic conditions can reduce their dependence on fuels like oil or natural gas.
Once a hydropower plant is built, it can operate for decades with relatively low maintenance costs.
This makes hydropower an excellent choice for a country’s energy independence, without being affected by global fuel prices or shortages.
💧 Chapter 1 – Hydro Basics
🌊 Basics – Wonders of Moving Water
🎯 Learning Objective
By the end of this chapter, you will be able to:
- Understand the Essentials of Hydropower: Gain a solid grasp of the geographical locations and natural conditions that make hydropower possible.
- Discover the Power of Rivers: Learn how rivers, with their dynamic flows and diverse conditions, play a critical role in generating hydropower.
- Dive into Ocean Energy: Explore the fascinating motion of tides and waves and see how innovative systems harness their immense energy potential.
- Harness the Energy of Mountains: Investigate how falling water in mountainous regions transforms potential energy into kinetic energy, driving turbines like water wheels to produce electricity.
- Marvel at Dams and Reservoirs: Delve into the construction of colossal dams and reservoirs, understanding how they control water flow and fuel large-scale energy production.
- Environmental Impacts of Moving Water: Gain fundamental insights into how moving water shapes the land and interacts with ecosystems around it.
By the end of this chapter, you’ll be empowered with foundational knowledge about water energy systems, ready to make informed decisions about optimizing their performance and understanding their role in a sustainable energy future!
🌊 🗺️ 1.1 Where is Hydro Energy Found?
💡 Hydro Power Hunt Challenge
In this Challenge, you and your team will explore and identify potential locations where you would expect hydro energy to be located, focusing on specific regions.
✍️ Exercise: Task 1
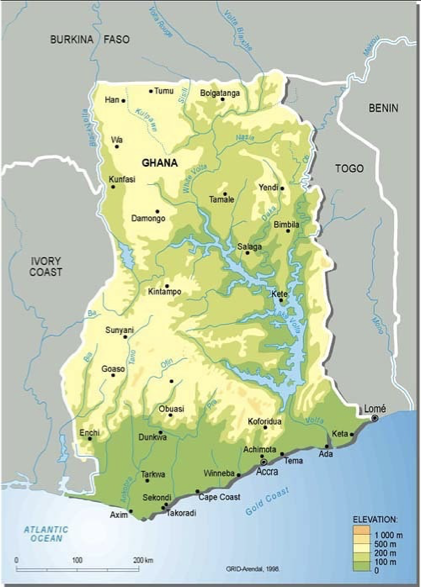
Divide into groups of 3-5 Student. Each group will work together to complete the challenge and share their insights with the class afterwards! Below you will find a map of Ghana to work with!
- Find good Hydropower Locations: Look at the map and mark places where you think hydropower could work well. Use 3-5 colored dots.
- Why these spots: For each dot write down 1-2 short reasons why it would be a suitable location.
- Choose the best location: For each dot write down 1-2 short reasons why it would be a suitable location.
- Present your Findings and discuss in class!
✍️ Exercise: Task 2
🔄 Hydro Energy and Energy Conversion
In regions water can flow very fast, creating more energy. Water stored behind a dam has energy because of its height. When water flows downhill due to , it gains energy. The moving water spins , which are connected to a to create electricity. The word “hydro” comes from the Greek word for . Hydro energy is a energy source. It uses the movement of water to perform . also inhabit hydro energy, which can be harnessed with innovative concepts. are large structures built to block and control the flow of water, aiding in hydroelectric energy production.
💧 The Water Cycle
Fill in the blanks with the correct words from the word bank:
The moves water around the Earth and atmosphere in different stages.
First, water turns into vapor through
when the heat from the warms it.
Next, the vapor cools and turns into tiny droplets in the process called .
These droplets come together to form clouds. Then, water falls back to the Earth as rain, snow, or hail, a process known as .
Finally, the water collects in rivers, lakes, and oceans, completing the cycle.
0/16 richtig
The water cycle, driven by solar energy, operates through four key stages:
- Evaporation: Water from oceans, lakes, and rivers turns into vapor and rises into the atmosphere.
- Condensation: The vapor cools and forms clouds.
- Precipitation: Rain or snow falls, often in mountainous regions.
- Collection: Water gathers on the ground and flows into rivers, completing the cycle.
There are various locations where water energy can be harnessed effectively.
The most important ones are:
- Rivers: Providing a water stream and continuous water motion.
- Oceans: Utilizing the movement of tides and waves.
- Mountainous regions: Harnessing the natural downhill flow of water, driven by gravity, to generate energy.
Each of these sources offers distinct advantages and faces unique challenges.
Understanding their potential enables the development of effective strategies for harvesting water’s energy while ensuring sustainability.
🌊 1.2 Rivers
Rivers are one of the most important natural sources of hydro-energy. Their moving water carries kinetic energy, which can be converted into electricity. Because rivers flow continuously, they can provide a steady and reliable supply of energy—much more consistent than wind or sun.
📝 Exercise
Task 1
Team up with your seat neighbor and think about a river nearby.
- Did you experience differences in the flow of its water stream during the year?
- When and why did the water stream appear differently?
- Are there parts of the river that have quicker water streams? If so, what could cause these differences?
You may answer in bullet points or create a sketch with descriptions.
Rivers are a vital source of Hydro-Energy, providing the continuous water flow needed to power turbines and generate electricity.
Seasonal variations significantly impact river flow:
- Rainy Season: Higher water levels increase energy production.
- Dry Season: Lower flow reduces energy output.
Dams help regulate river flow to ensure consistent energy generation but may require careful management to mitigate environmental and community impacts.
Rivers are widely available, renewable, and capable of properly managing reliable energy, making them a key component of Hydro-Energy systems.
🌊 1.3 Oceans
The target of this exercise is to explore how the motion of ocean water can be harnessed to produce renewable energy. You will investigate technologies like tidal and wave energy systems that transform this natural motion into sustainable power sources.
📝 Exercise
Task 1 – Understanding Tides and Wave Energy
Take some minutes to go through these questions. You may discuss with a partner.
- What natural forces create tides and waves in the ocean?
- What do you think is the largest tidal difference (highest and lowest water levels) found on earth?
- How might we use these natural forces, like tides and waves, to generate hydropower?
- Huge Potential: Oceans cover most of Earth’s surface and hold large amounts of renewable energy.
- Tidal Energy: Uses the rise and fall of tides caused by the moon and sun. Tides are predictable and consistent.
- Wave Energy: Uses the up-and-down motion of waves created by wind moving across the ocean.
- Example: The Bay of Fundy in Canada has one of the world’s strongest tidal ranges, showing how powerful ocean energy can be.
- Challenges: Harsh ocean conditions make building and maintaining equipment difficult.
- Future Outlook: With better technology, ocean energy could become an important part of global renewable electricity.
⛰️ 1.4 Mountain Regions
The target of this exercise is to understand how hydro energy can be effectively harnessed in mountainous regions. Mountains are excellent places for hydropower because steep slopes create fast-moving water. In this activity, you’ll explore how slope, flow speed, and location influence energy production.
📝 Exercise
Task 1 – Understanding Hydro Energy in Mountainous Regions
Compare the two locations
Look at the Zone A and B shown above and answer the following questions with a few bulletpoints.
- Where is the water moving fastest and why?
- Which zone would generate more energy for a hydropower plant?
- Which zone is easier to build on? Explain briefly.
🌍 1.5 Pumped Hydropower Storage
When energy needs to be stored, water can also be used as a giant natural battery. Pumped hydropower storage consist of two water reservoirs located at different heights. When there is surplus electricity in the grid, for example from renewable energies on very sunny or windy days, water is pumped from the lower reservoir up to the upper reservoir. To generate electricity again later, the water flows to the lower reservoir, it drives a turbine and gravitational energy is converted to electricity.
📝 Exercise
Task 1: Decide when to use pumped hydro
| Scenario | Pump water up or generate electricity? | Why? |
|---|---|---|
| Early afternoon on a sunny day where solar energy is very high | ||
| Cold, windless early winter evening, people turn on heating cook dinner and lights are turned on. | ||
| Regional power line unexpectedly fails, where the grid operator needs a quick and stable supply of energy. | ||
| Strong storms bring powerful winds so that wind turbines generate much more energy than the grid can absorb | ||
| A high-energy industrial facility unexpectedly shuts down for maintenance. |
- The waterfall effect refers to the energy generated by water falling from a height.
- This is a key principle behind many hydroelectric systems and works because gravitational potential energy is converted into kinetic energy, which can then be transformed into mechanical or electrical energy.
- In other words: Water at the top of a hill (elevated) = stored energy (potential energy).
- Falling water: When the water starts falling, gravity pulls it down, turning that stored energy into motion.
- Spinning the water wheel: The motion of the water is used to produce useful energy.
- The same principle works for both small water wheels and large hydropower dams.
- Efficient Energy Generation: Mountainous regions have fast-flowing rivers and steep inclines that are ideal for hydropower.
- Support for Remote Areas: Hydroelectric systems can provide reliable electricity to isolated communities in mountainous regions.
- Economic Development: Harnessing water energy supports local economies through job creation and infrastructure improvements.
- Low Environmental Impact: When responsibly managed, hydro energy systems in these regions cause minimal ecological disruption compared to other energy sources.
⚙️ Chapter 2 – Different Turbine Types
🎯 Learning Objective
- In this chapter, you will embark on an exciting journey into the world of hydropower.
- Together with your team, you will construct your very own water wheel and explore the mechanics behind its operation. This hands-on task will help you understand how to efficiently run a hydroelectric power plant and uncover the critical role that buckets play in its functionality.
- You will also investigate the ideal types of water motion for a water wheel and discover how this connects to the formula for energy in hydropower systems.
- Additionally, through a hands-on experiment, you will see state-of-the-art turbines and learn about three distinct turbine designs.
- You will explore how these turbines differ, the principles behind their operation, and the reasons for their unique designs.
In this chapter, the goal to understand the three major types of water turbines, their unique designs, and the specific conditions in which they operate most efficiently. You will gain insight into why different turbine types are necessary to harness the energy of water effectively in various environmental and flow conditions.
📝 Exercise
Task 1:
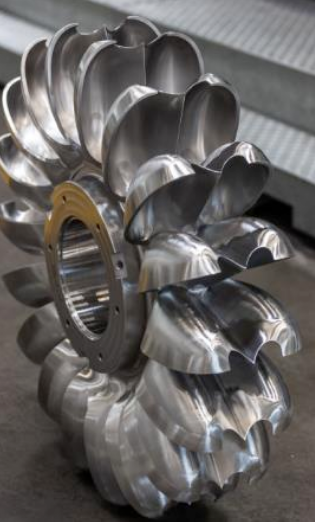
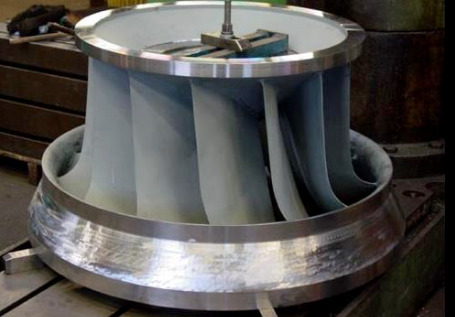
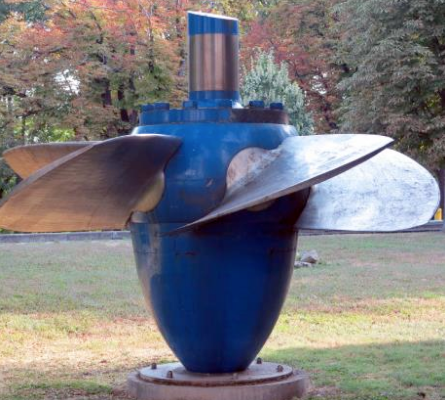
Identify the respective turbine type
0/3 richtig
Task 2:
Guess! Why do you think shown Turbine Types do exist
Task 3:
Which Turbine Type would you recommend for following operation range scenarios:
- Very High head height and low flow rate of the water.
- Low head height and high flow rate.
- Medium head height and very high flow rate.
For every scenario add a location where those conditions could be found in real world (for example: River, Dam, …)
The Kaplan, Francis, and Pelton turbines exist because water behaves differently in various environments, requiring specific turbine designs to harness its energy efficiently.
-
Kaplan Turbine: Ideal for large volumes of slow-moving water with low height differences, such as wide rivers.
Head range: 2–50 m | Flow rate: up to 800 m³/s -
Francis Turbine: Best for environments with a balanced combination of flow rate and height, like medium-sized dams.
Head range: 30–700 m | Flow rate: up to 800 m³/s -
Pelton Turbine: Designed for high water pressure and large height differences, such as tall mountain dams.
Head range: 150–2000 m | Flow rate: up to 60 m³/s
These three turbine types perform better in different environments because they are optimized for specific water flow conditions (speed, volume, and pressure) to maximize energy generation.
💧 Chapter 3 – Factors Affecting Turbine Performance
In this chapter, you will explore:
- Height of water (Head): Learn how increasing the height of water increases its speed using Torricelli’s Law → faster water means more power for the Pelton wheel.
- Water Flow & Resistance: Discover how the water path and any obstacles or rough surfaces cause energy losses, like electrical resistance in a circuit.
- Water Volume: See why a turbine needs enough water flow to keep producing useful power → more water means more available energy.
- Turbine Design & Efficiency: Investigate how the shape and alignment of Pelton buckets decide how well the turbine captures the jet’s kinetic energy.
This chapter will show you how mechanics and physics combine to transform falling water into electricity, and how engineers improve turbine performance for real hydro-energy systems.
Torricelli‘s Law – Pelton Turbine
Torricelli’s Law and Hydropower
Torricelli’s Law explains how fast water flows out of a hole or nozzle. It says that the speed depends on the height of the water above the opening (called the head in hydropower). A higher head gives faster water.
Formula:
In Pelton turbines, high-pressure water is turned into a high-speed jet using a nozzle. The faster the jet, the more force it has to spin the turbine, producing more electricity.
More height → faster jet → more power

Exercise – Apply your knowledge!
A reservoir feeds water to a Pelton turbine through a nozzle. The height of the water surface above the nozzle is 50 m.
- Calculate the speed of the water jet as it leaves the nozzle.
- If the water level drops 25m, calculate the new speed.
- Which case would produce more power from the turbine? Why?
Torricelli‘s Law – Losses – Friction
Hydraulic Losses and Efficiency
Energy losses occur due to friction, turbulence, air resistance, and improper jet–bucket interaction.
When water travels through a pipe, some of its energy is lost because of friction with the pipe walls.
This loss reduces the water speed coming out of the nozzle and therefore reduces the power produced.
We describe this energy loss as a head loss, measured in meters of water column.
To calculate the actual useful height of water:
Formula:
Updated Torricelli’s Law:
- Total water height: h = 50 m
- Head loss due to friction: hL = 10 m
Exercise – Apply your knowledge!
- Calculate the effective head heff.
- Calculate the water jet speed v with losses.
- Would this system generate more or less power than one with no losses? Explain why.
Obstacles and Force
Effect of Obstacles on the Force of Water
When water flows through a pipe or channel, its movement can be slowed down by obstacles.
These can include rough surfaces, debris, or objects in the water.
The more the flow is disrupted, the less force the water has when it reaches the turbine.
| Type of Obstacle | Effect on Water Flow |
|---|---|
| Soft / Absorbent (cotton, sponge, plant material) | Absorbs water and creates high resistance → big drop in speed and force |
| Smooth / hard (metal, polished surfaces) | Water slips around easily → small drop in speed |
Water Level and Force
A deeper water reservoir creates higher pressure at the bottom.
- More water above the turbine → stronger flow → more power
- More water height → more pressure → more flow
If the water level drops too low, the turbine can’t receive enough flow to generate full power.
Why This Matters in Hydropower
Engineers must:
- Keep water pressure high
- Reduce resistance (smooth pipes, clean systems)
- Stop obstacles from blocking flow
This helps turbines spin faster and produce maximum electricity.
Applying What You Learned!
-
What happens to the force of water when it flows through a channel with obstacles?
-
Why does a deeper water reservoir create stronger flow at the bottom?
-
Which of the following helps turbines generate maximum electricity?
-
Why is it important for engineers to maintain smooth pipes in a hydropower system?
-
What happens if the water level in a reservoir drops too low?
0/5 correct
🔌 Chapter 4 – Concepts of Grid and Combining DERs
⚡ Baseload and Reliability
Exercise
-
Explain in your own words what baseload power is and why it is important for homes and schools.
-
Compare the reliability of solar, wind, and hydro power. Which is the most dependable for providing continuous electricity, and why?
-
How can solar and wind energy be made more reliable when the sun isn’t shining or the wind isn’t blowing? Give at least two examples.
-
Imagine you are designing a new city’s electricity system. How would you combine solar, wind, and hydro to ensure the lights stay on all day and night?
⚖️ Energy Balancing
Generation = Demand
Understand the causes and effects of fluctuating renewable electricity generation when it meets varying energy demand.
Explore how these fluctuations impact the energy grid, including issues like surpluses and deficits.
Gain hands-on experience in identifying strategies to achieve and maintain a perfect balance within the system,
ensuring grid stability and efficiency.
TASK 1: Based on what you have learned so far and the table above, answer the following questions.
-
What can you tell about the electricity generation of PV, wind, and hydro?
-
Rank the reliability of the three renewable energy sources from highest to lowest!
-
What is surplus/deficit energy, and how is it calculated? Why is it important?
-
What would you consider baseload and peakload when looking at the whole week?
TASK 2: Balance that Grid! Now it is your turn to calculate and balance the grid above.
-
Calculate the surplus/deficit energy during the evening (16:00–24:00)?
-
How would you handle a deficit in the energy grid? What could you do in this situation to avoid a blackout due to a deficit in the evening?
-
Calculate the deficits/surpluses for each period on Thursday and Friday.
🎲 Design an energy grid game
Students will design and operate a simulated power grid, making decisions about energy generation, storage,
and connectivity to meet the demand of a central grid while dealing with variability in energy sources.
Exercise
Materials Needed:
- Grid template (provided in the workbook)
- Markers or pens
- Notebook
Instructions
Students are given a blank grid template with three energy zones (Solar, Wind, Hydro) and one central demand zone.
They must:
- Draw connections between the energy zones and the central demand zone.
- Decide whether to connect a battery storage and where to place it.
Grid template
🎲 Design an energy grid game
Playing the Game
Materials Needed:
- One six-sided dice per energy zone (or one dice used independently for each energy zone, or a virtual dice)
- Student notebooks (to track energy generation, usage, and demand)
- Battery tracker (drawn in their notebooks, max capacity: 10 energy units)
- Demand tracker sheet (provided in the workbook)
Gameplay Rules
Set Up the Notebook:
- Students create a simple table in their notebooks to track:
- Energy generated by each source (solar, wind, hydro)
- Energy stored or retrieved from the battery
- Energy sent to the central grid
- Total energy available vs. demand for each round
- Draw a battery tracker with a max capacity of 10 units to record energy storage and dissipation.
Roll the Dice for Energy Generation: Each energy zone rolls one six-sided die to determine its energy output.
Students record the results of the dice rolls in their notebook under “Energy Generated.”
| Solar: Dice Result |
Solar: Energy Generation |
Wind: Dice Result |
Wind: Energy Generation |
Hydro: Dice Result |
Hydro: Energy Generation |
|---|---|---|---|---|---|
| 1 | 2 energy units | 1 | 1 energy units | 1 | 5 energy units |
| 2 | 3 energy units | 2 | 2 energy units | 2 | 6 energy units |
| 3 | 4 energy units | 3 | 4 energy units | 3 | 7 energy units |
| 4 | 5 energy units | 4 | 6 energy units | 4 | 8 energy units |
| 5 | 6 energy units | 5 | 7 energy units | 5 | 9 energy units |
| 6 | 8 energy units | 6 | 9 energy units | 6 | 10 energy units |
🎲 Design an energy grid game
Decide on Connections
- Students decide which energy zones will connect to the central grid or battery.
- For every connection used, students subtract 1 energy unit per round in their notebook under “Connection Cost.”
Store and Retrieve Energy
- Excess energy can be stored in the battery (max capacity: 10 units).
- If demand exceeds generation, stored energy can be retrieved from the battery.
- Each turn, subtract 1 unit from the battery tracker for energy dissipation.
Meet the Demand
Students calculate the energy sent to the grid from connected zones and the battery (if used).
Compare the total energy sent to the demand level:
- Round 1 Demand: 10 units
- Round 2 Demand: 15 units
- Round 3 Demand: 20 units
Record the outcomes in the notebook:
- Shortfall: Energy available is less than demand.
- Excess: Energy available exceeds demand (recorded as wasted energy).
Scoring
- Reliability: 2 points for each round where demand is fully met.
- Efficiency: 1 point for minimising wasted energy (1 point for each round with zero excess energy).
- Strategy: 1 bonus point for practical battery usage (e.g., no overflows or under-utilization).
Discussion
Once the game is finished, answer the following questions:
- How did variability in energy generation (dice rolls) impact your ability to meet demand?
- How did your choice to use (or not) the battery affect your grid’s reliability?
- If you redesigned the grid, how would you improve reliability and efficiency?
- What lessons can you apply from this activity to real-world energy systems?