👋 Welcome
Welcome to the Solar Learning Adventure! Click "Next" to begin your journey.
☀️ Welcome to the World of Solar Power!
Photovoltaic (PV) technology transforms sunlight into electricity—cleanly and renewably. In this workbook, you’ll discover how solar energy works and why it’s essential for a sustainable future.
🌍 Why Learn About Solar Energy?
With the challenges of climate change and limited fossil fuels, solar energy offers a clean, reliable alternative. By learning how PV systems work, you’re contributing to a greener tomorrow.
📚 What You’ll Learn
- How PV Technology Works: Discover how sunlight becomes electricity
- Solar Panel Types: Understand the pros and cons of different technologies
- Performance Factors: What influences how much energy panels produce
- System Connections: Learn how solar connects to homes, schools, and industry
- Hands-On Projects: Bring it to life through real experiments
🔍 How It Works
This workbook blends explanation with action. Through hands-on tasks and clear examples, you’ll engage with real solar technology and build understanding step-by-step.
⚡ Get Ready to Shine!
By the end of this workbook, you’ll understand how solar energy works and why it matters. You’ll gain knowledge, skills, and the confidence to shape the future of clean energy. 🌞
☀️ Why is Photovoltaic (PV) Energy Important?
This part introduces you to Photovoltaic (PV) energy! “Photo” means light, and “Voltaic” refers to electricity. PV technology transforms sunlight into usable electricity. It’s more than science—it’s about powering our lives and protecting our planet.
🌟 Key Advantages of PV
- ☀️ Renewable Energy Source: As long as the sun shines, we can generate electricity—making it a sustainable alternative to fossil fuels.
- 🌱 Environmentally Friendly: PV systems produce no emissions and help reduce pollution.
- 💰 Low Operating Costs: After installation, sunlight is free—and maintenance is minimal.
- 🔌 Energy Independence: Communities can generate their own power, increasing self-reliance and resilience.
- 🏠 Multiple Applications: From rooftops and farms to backpacks and boats, PV can power almost anything!
🇬🇭 Why is PV Important in Ghana?
With abundant sunshine year-round, Ghana is perfectly positioned to harness solar energy. PV systems reduce dependence on fossil fuels, cut costs, and strengthen community-level energy security. Solar is expected to become a key pillar of Ghana’s renewable energy future.
🚀 What’s Next?
In the next chapters, you’ll discover how PV systems work, what affects their performance, and how to maintain them. With exciting hands-on activities, you’ll see solar power in action.
🌞 Let’s begin your journey into the world of PV!
📘 Key Terms: Solar Energy
Below are some important definitions to help you better understand how photovoltaic systems work. These terms will appear throughout your learning journey.
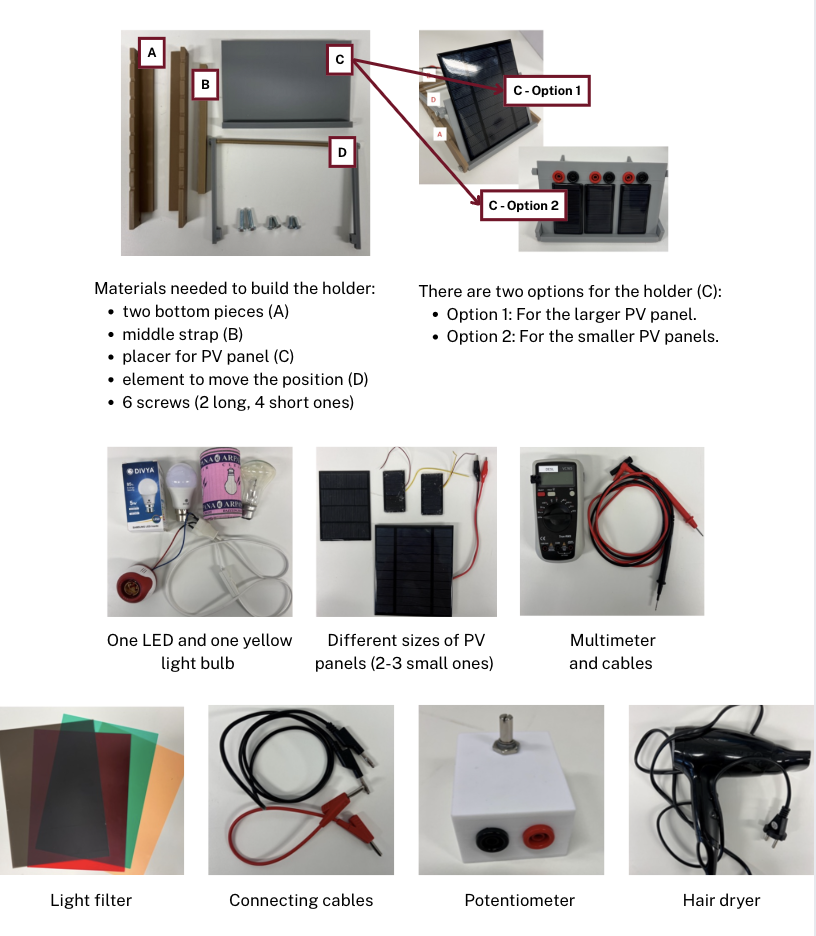
🔧 What is needed for this?
Additional Materials for Experiments
- 💨 Hair dryer: To heat up the PV panel.
- 🎚️ Potentiometer: To change the resistance.
- 🔌 Connecting cables: With banana plugs, used in series/parallel experiments.
- 🌈 Light filters: To evaluate how different light colors affect PV output.
- 🧪 Multimeter: To measure voltage, current, and resistance in the system.
The kit also includes other materials for specific experiments.
📦 PV Kit Overview
Inside the PV Kit box, you will find these components:
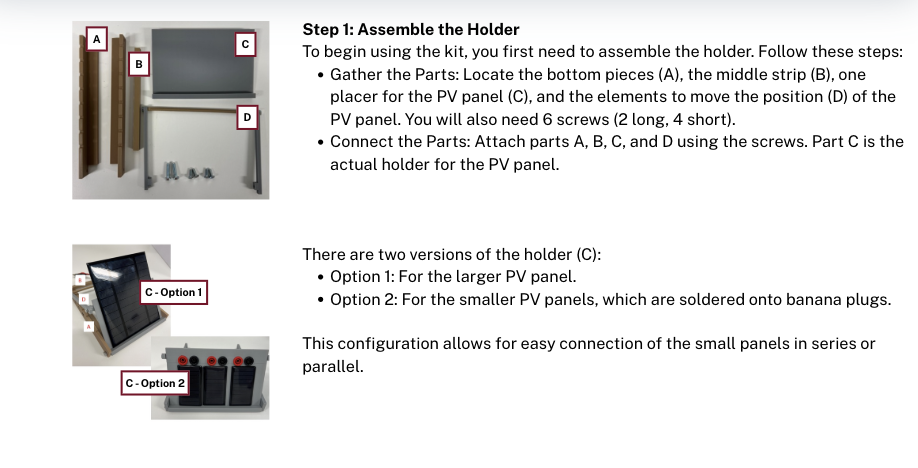
How to Start Using the PV Panel Kit
Follow these steps to assemble the PV Panel Kit:
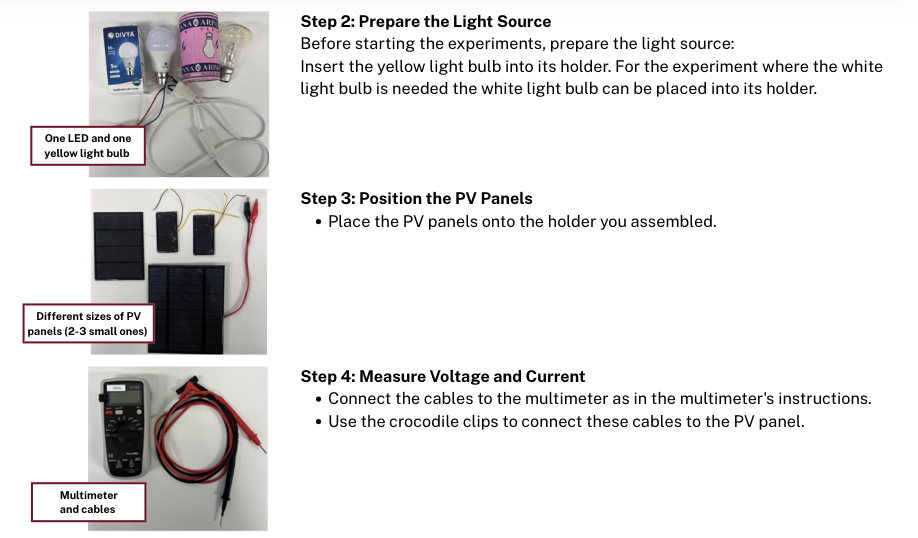
🧪 Multimeter
What is a Multimeter?
A multimeter measures electrical quantities like voltage, current, and resistance. Here’s how to use it and understand its key components:
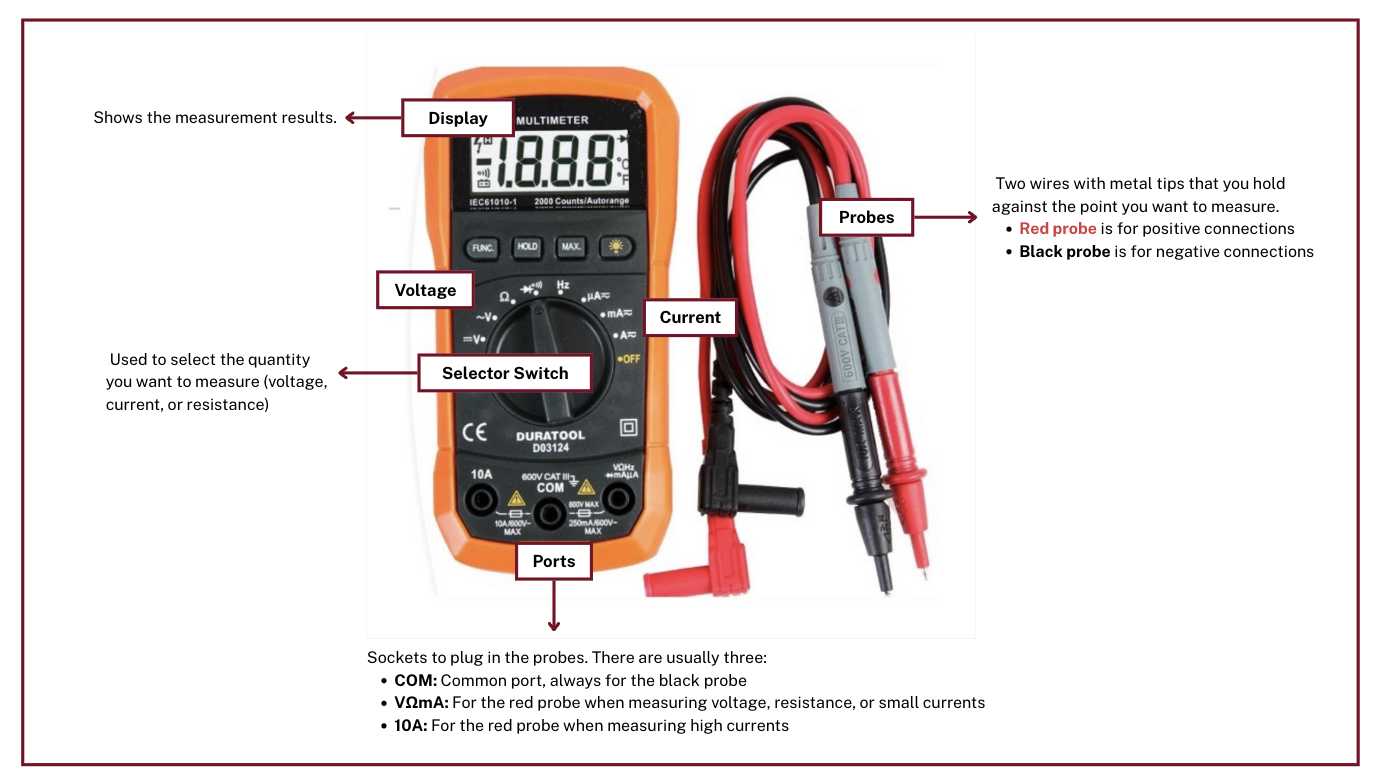
Parts of a Multimeter
Steps to Use a Multimeter
- Turn it on: Use the dial to power the device.
- Select measurement:
- Voltage (V): DC (–) or AC (~)
- Current (A): Preferably mA
- Resistance (Ω): Ω symbol
- Set range: Start with the highest expected range to avoid damage.
- Connect probes:
- 🔵 Black → COM
- 🔴 Red → VΩmA or 10A
- Take measurement:
- 🔋 Voltage → across two points
- 🔄 Current → inserted in circuit path
- 💡 Resistance → across component
- Read the display: Mind the unit (V, A, mA, Ω)
- Turn off: Set dial to OFF
⚠️ Safety First!
- Never measure voltage while in current or resistance mode.
- Always begin with the highest range setting.
- Do not touch the metal probe tips.
“Hands off!” Always be cautious for accurate and safe measurement.
Now you’re ready to measure and explore safely. Enjoy discovering the power of electricity! ⚡
📗 Chapter 1 – PV Basics
🌤️ External Factors Influencing PV Systems
In this chapter, you’ll explore how external factors such as:
- Light color (yellow/white)
- Angle of incidence
- Light intensity
- Heat
- Pollution
- Shade
By the end, you will be able to:
- Understand how PV systems convert sunlight into electricity
- Identify key factors that impact system performance
- Assess environmental conditions and their effect on efficiency
- Determine optimal placement and orientation for solar panels
- Apply your knowledge to real-world PV system setups
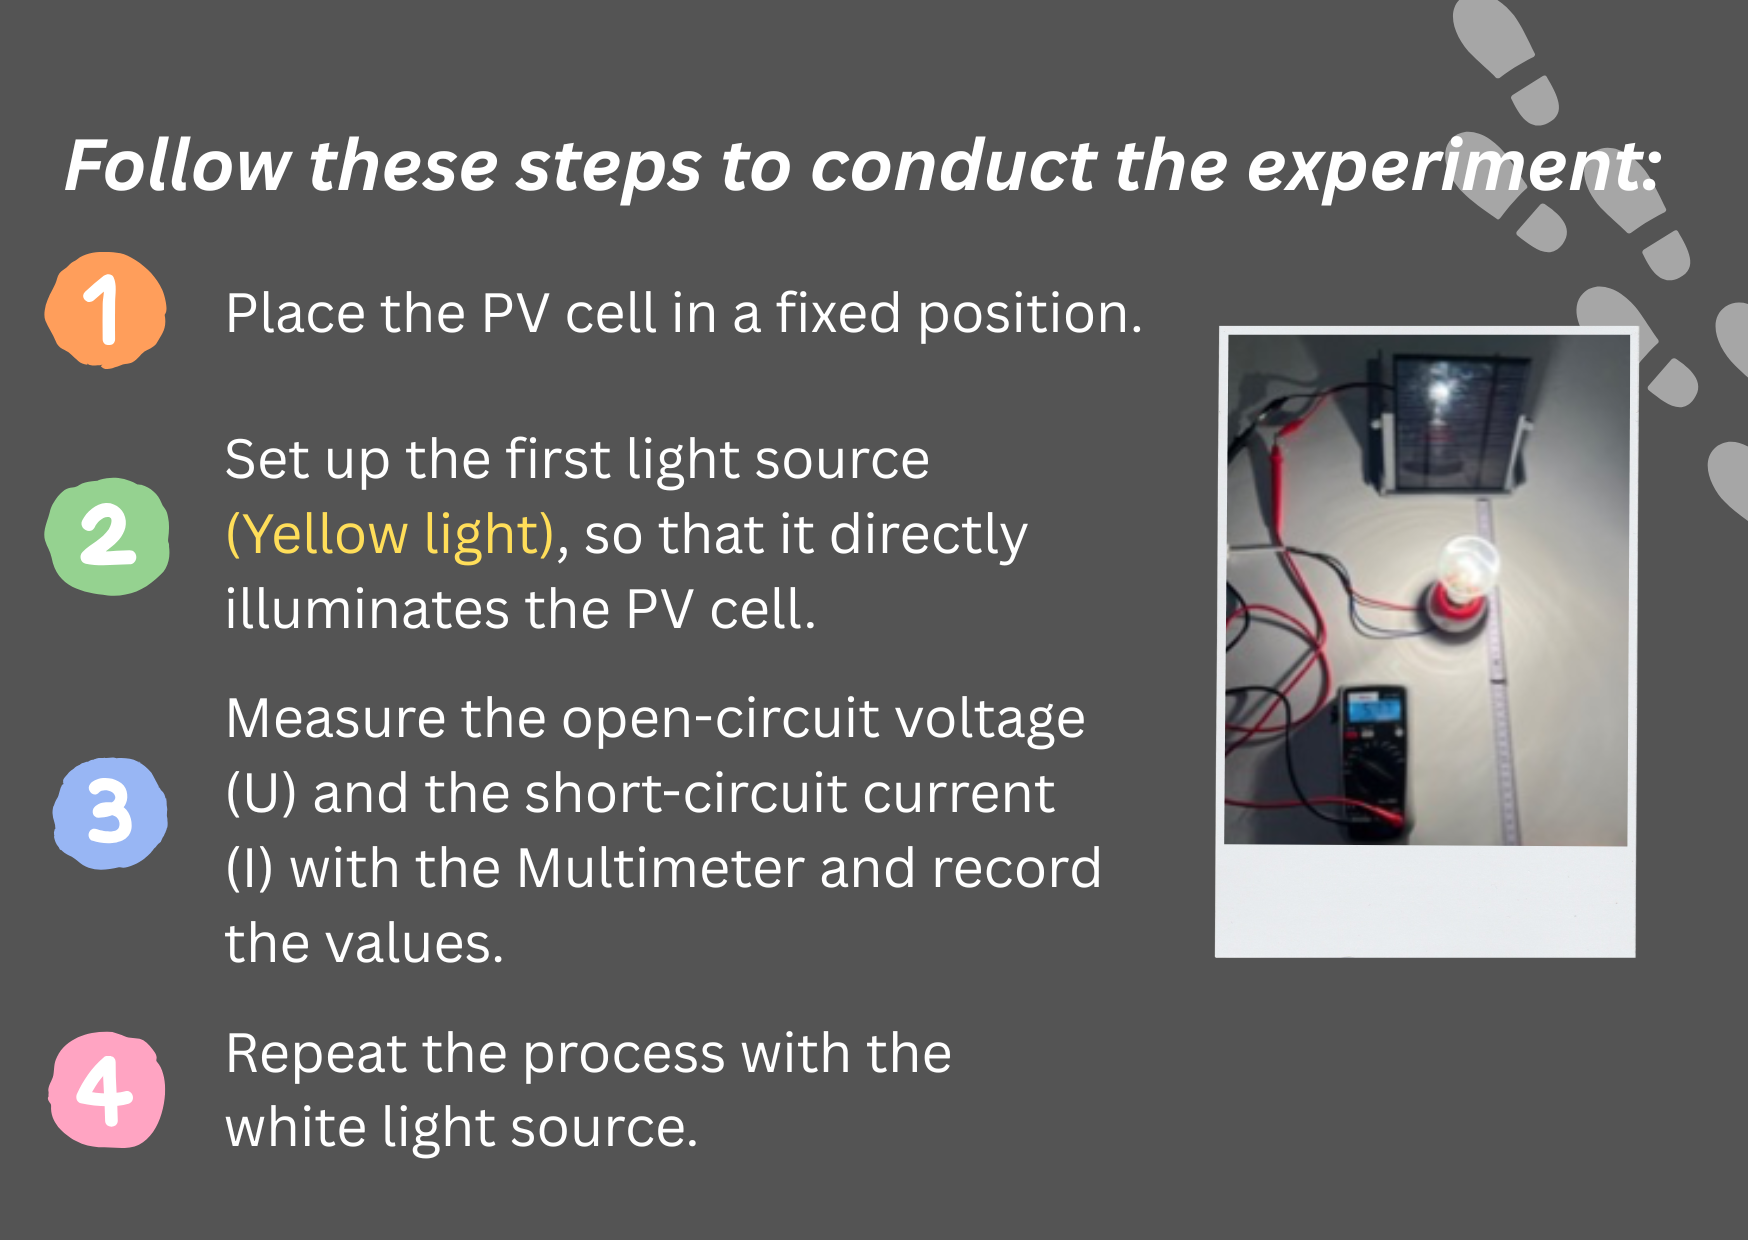
🌈 1.1 Light Color
In this section, you will find out how different light colors (wavelengths) affect the performance of a photovoltaic (PV) cell.
🔬 Experiment
Materials needed:
- Two lamps: LED and yellow light bulb
- PV modules (small or big)
- Multimeter
- Holder for PV panels
📝 Exercise
Task 1:
Which light source is less effective? Think about why and discuss with your neighbors.
Task 2:
Which curve is white light? Which one is yellow light? What fits to 1 and 2 in the graph?
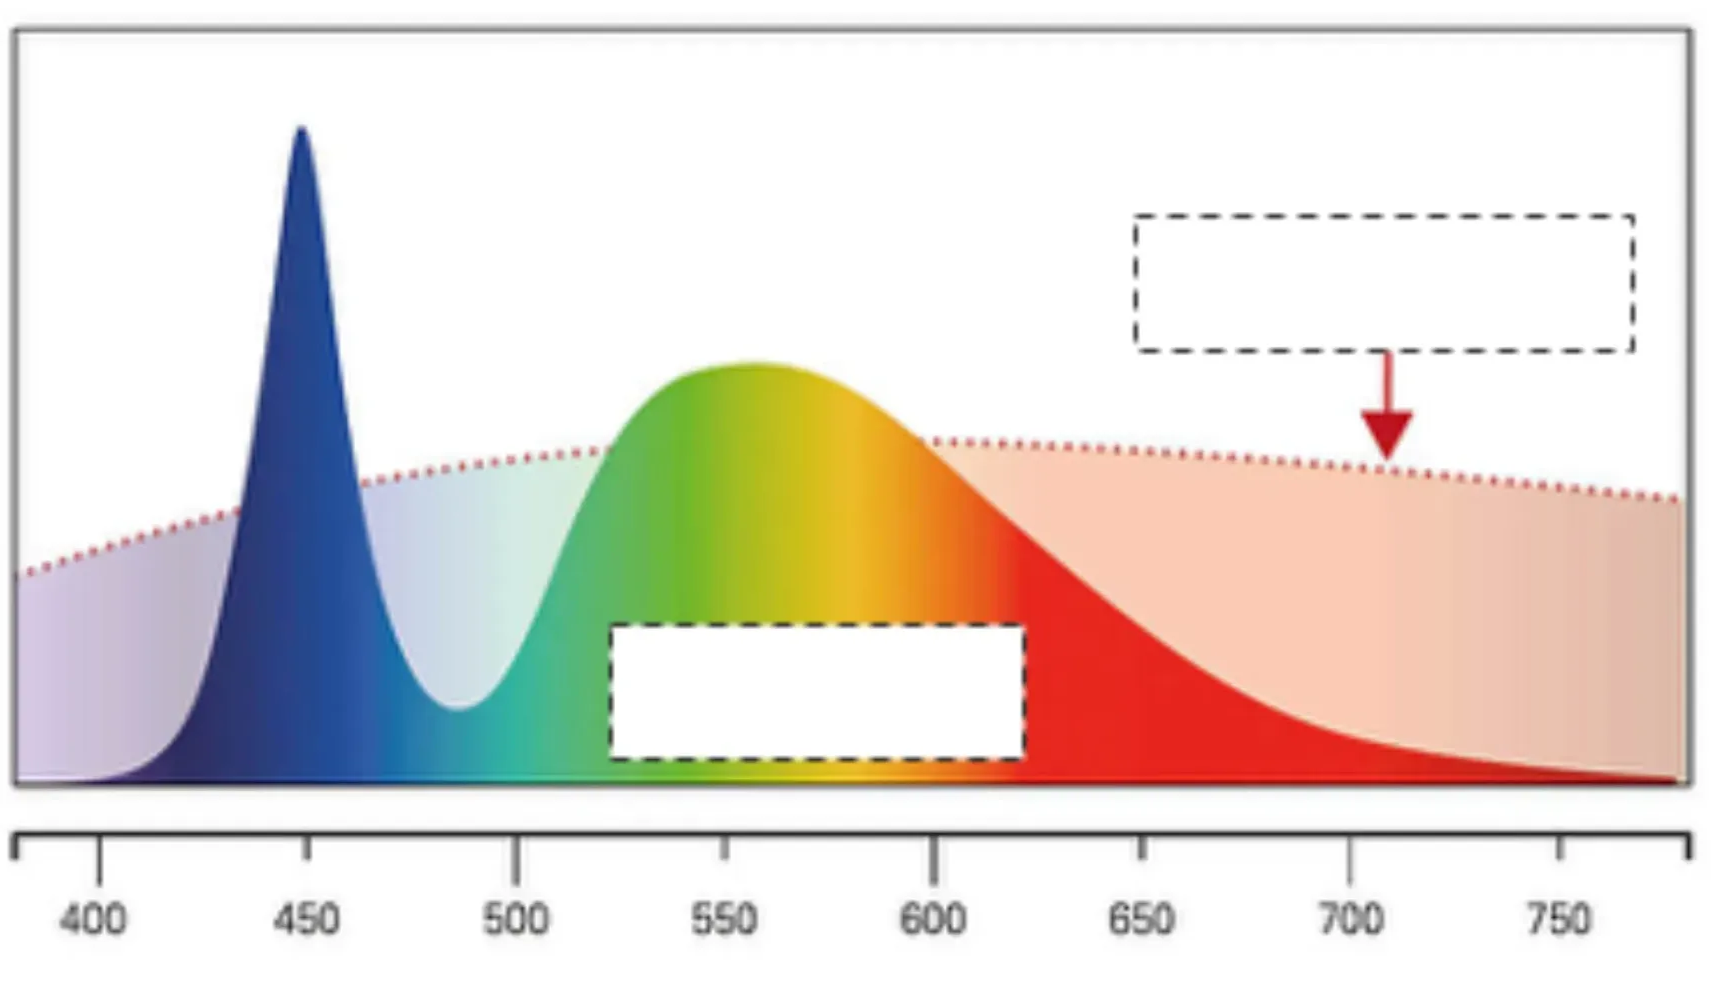
PV cells convert light into electricity. However, not all light is equally efficient. PV cells perform best with light in the yellow to red range, as it has the optimal energy for conversion.
Task 3:
Do the following statements refer to white or yellow light?
Statement 1:
This light contains all the colors. It has both high-energy and low-energy light.
– White Light
– Yellow Light
Statement 2:
This light, in the middle of the spectrum, has just the right energy and is absorbed efficiently by PV cells.
– White Light
– Yellow Light
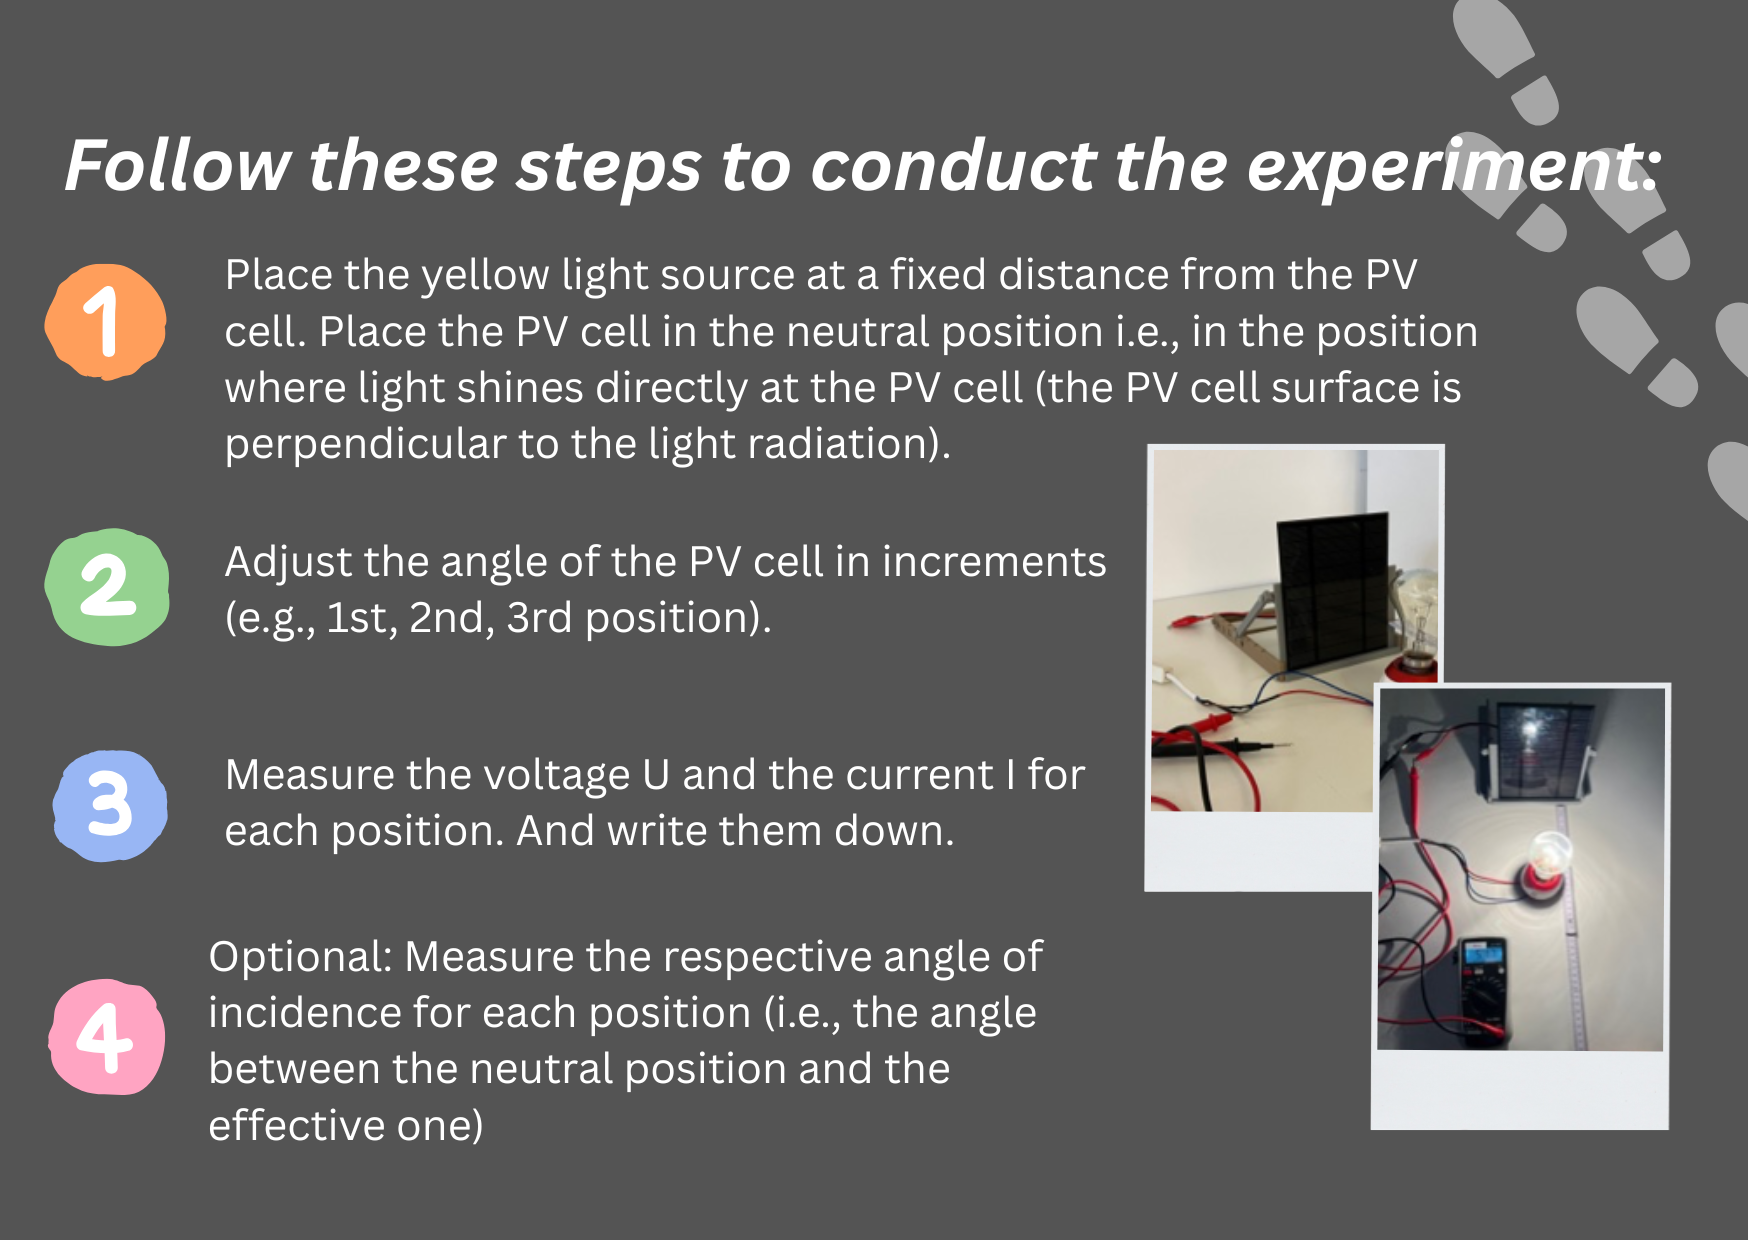
📐 1.2 Angle of Incidence
This section explores how the angle (inclination) of a PV cell affects its power output.
🔬 Experiment
Materials needed:
- One lamp (yellow light bulb)
- PV modules (small or big)
- Multimeter
- Meter rule
- Holder for PV panels
📝 Exercise
Task 1:
Based on your observations, which position leads to the highest current and voltage? What is the corresponding angle of incidence?
Task 2:
What is the relationship between the angle of incidence and the current/voltage?
Task 3:
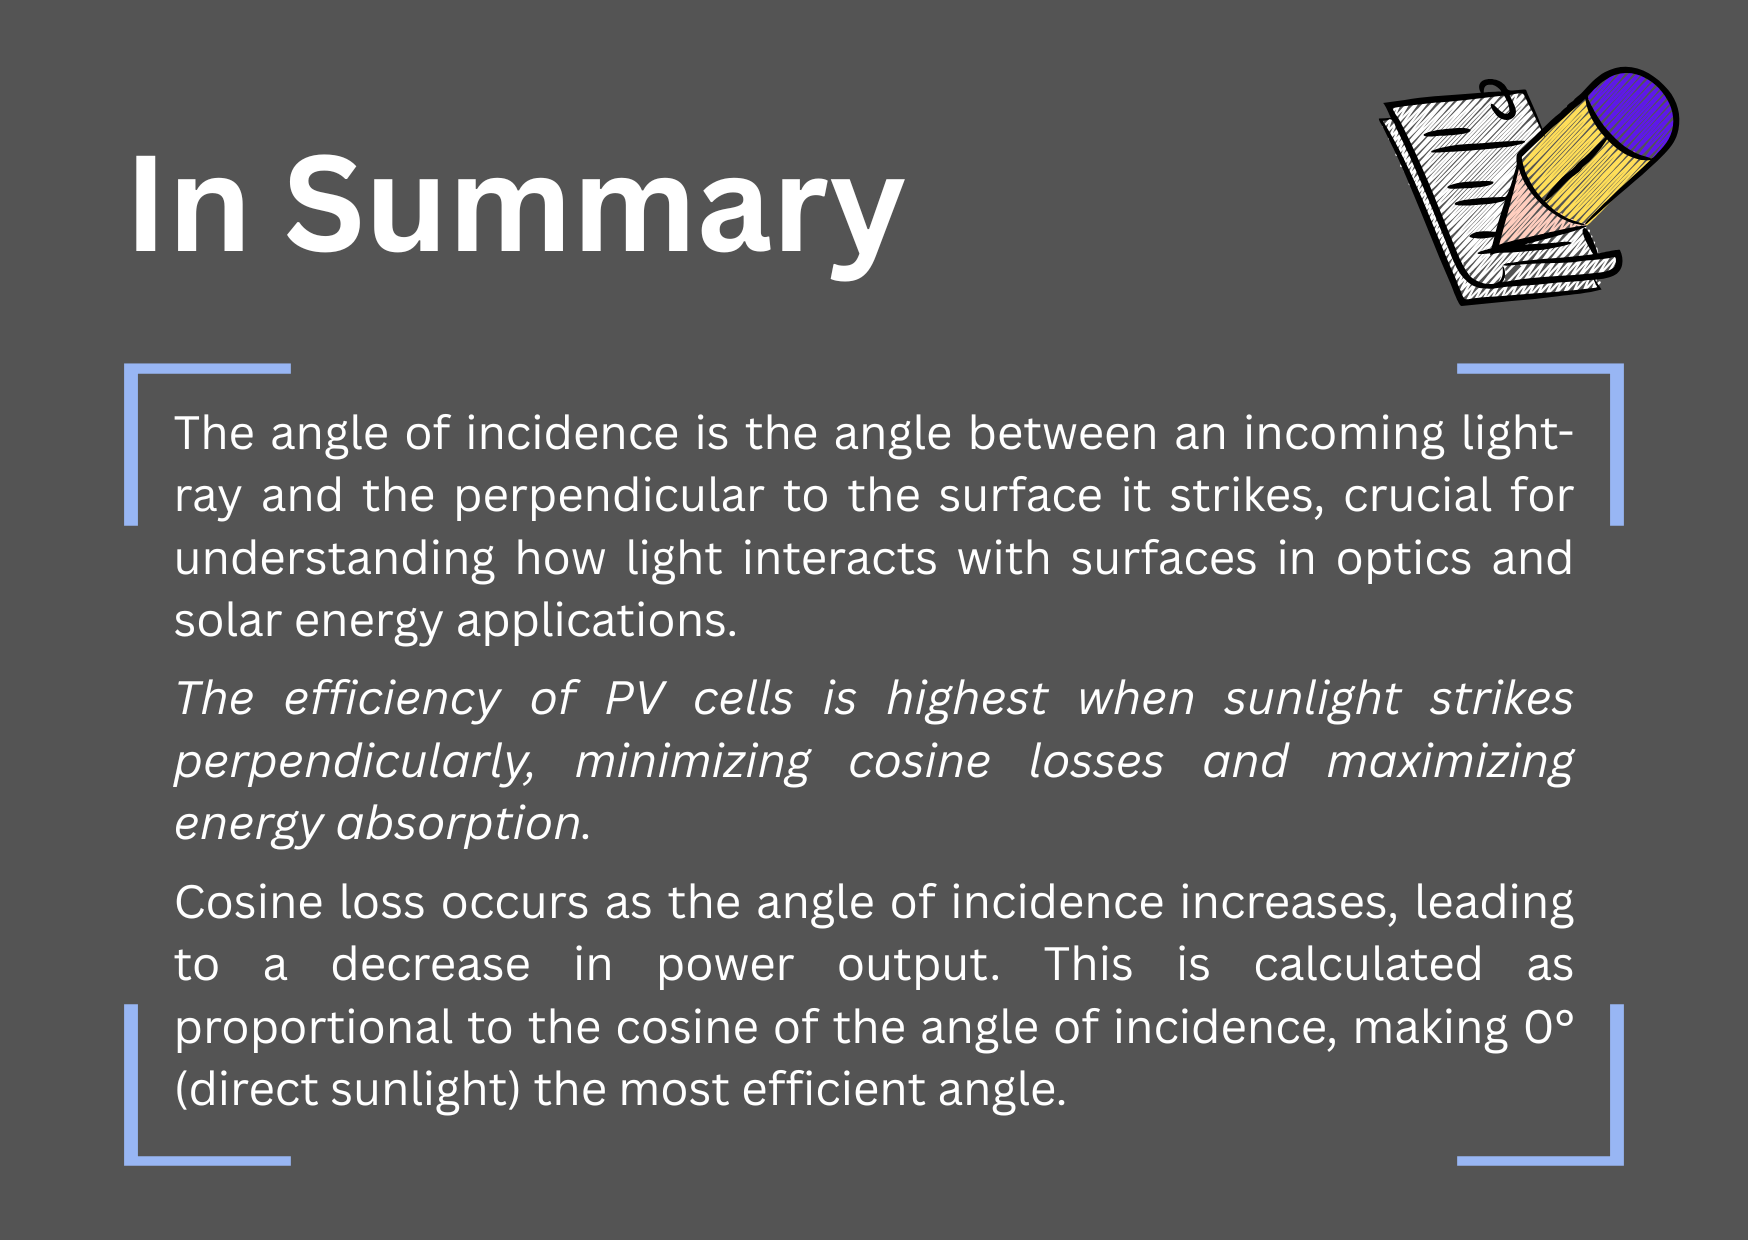
Derive the formula for inclination-induced losses based on the cosine law:
The power output of a PV cell is proportional to the cosine of the angle (θ) between the incoming light and the surface normal.– At θ = 0°, cosine is 1 → full power.– As θ increases, cosine(θ) decreases → lower power.
Task 4:
Assume the PV panel’s maximum power is Pmax = 100kWh. The angle of incidence is 30°. Calculate the effective power output Peff.
💡 1.3 Light Intensity
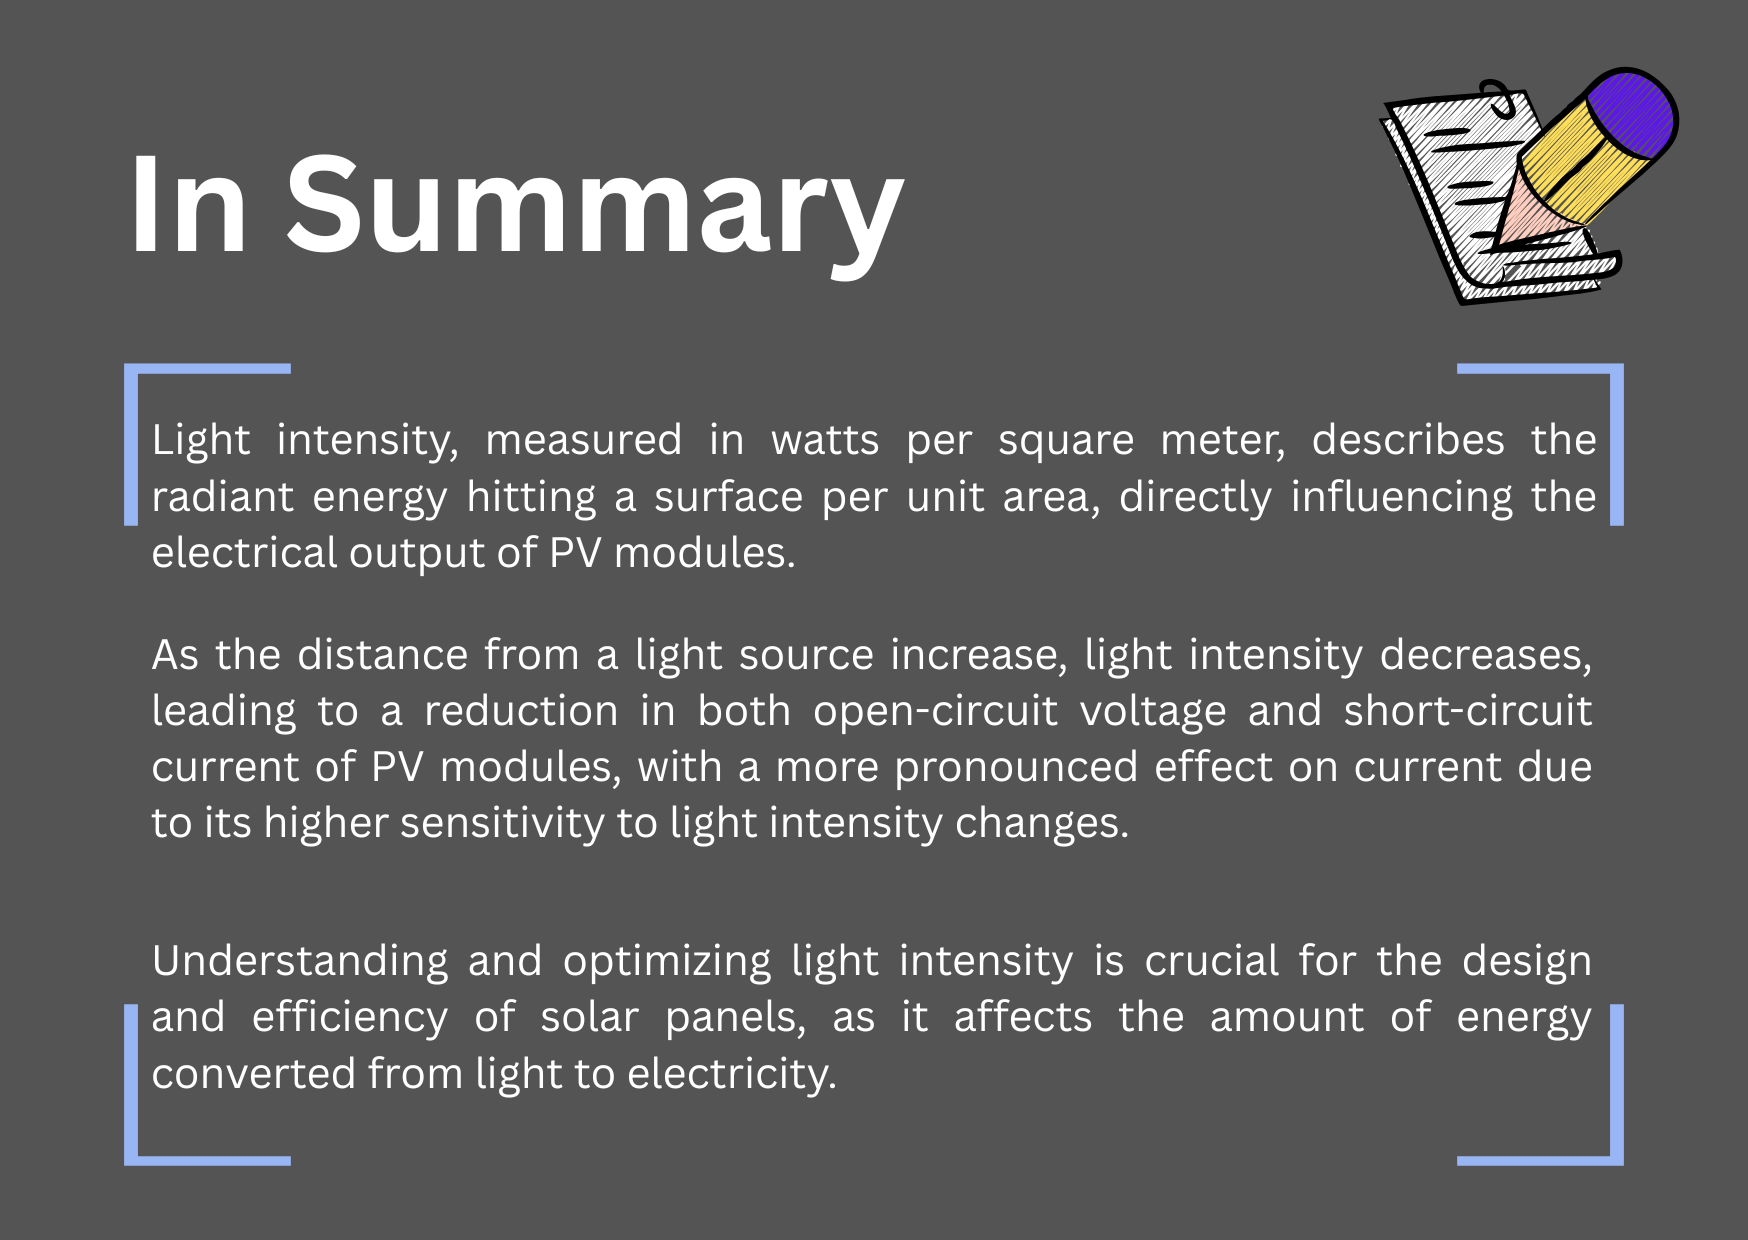
In this section, you will explore how the intensity of light affects the performance of a photovoltaic (PV) module.
🔬 Experiment
Materials needed:
- One lamp (yellow light bulb)
- PV modules (small or big)
- Multimeter
- Meter rule
- Holder for PV panels
📝 Exercise
Task 1:
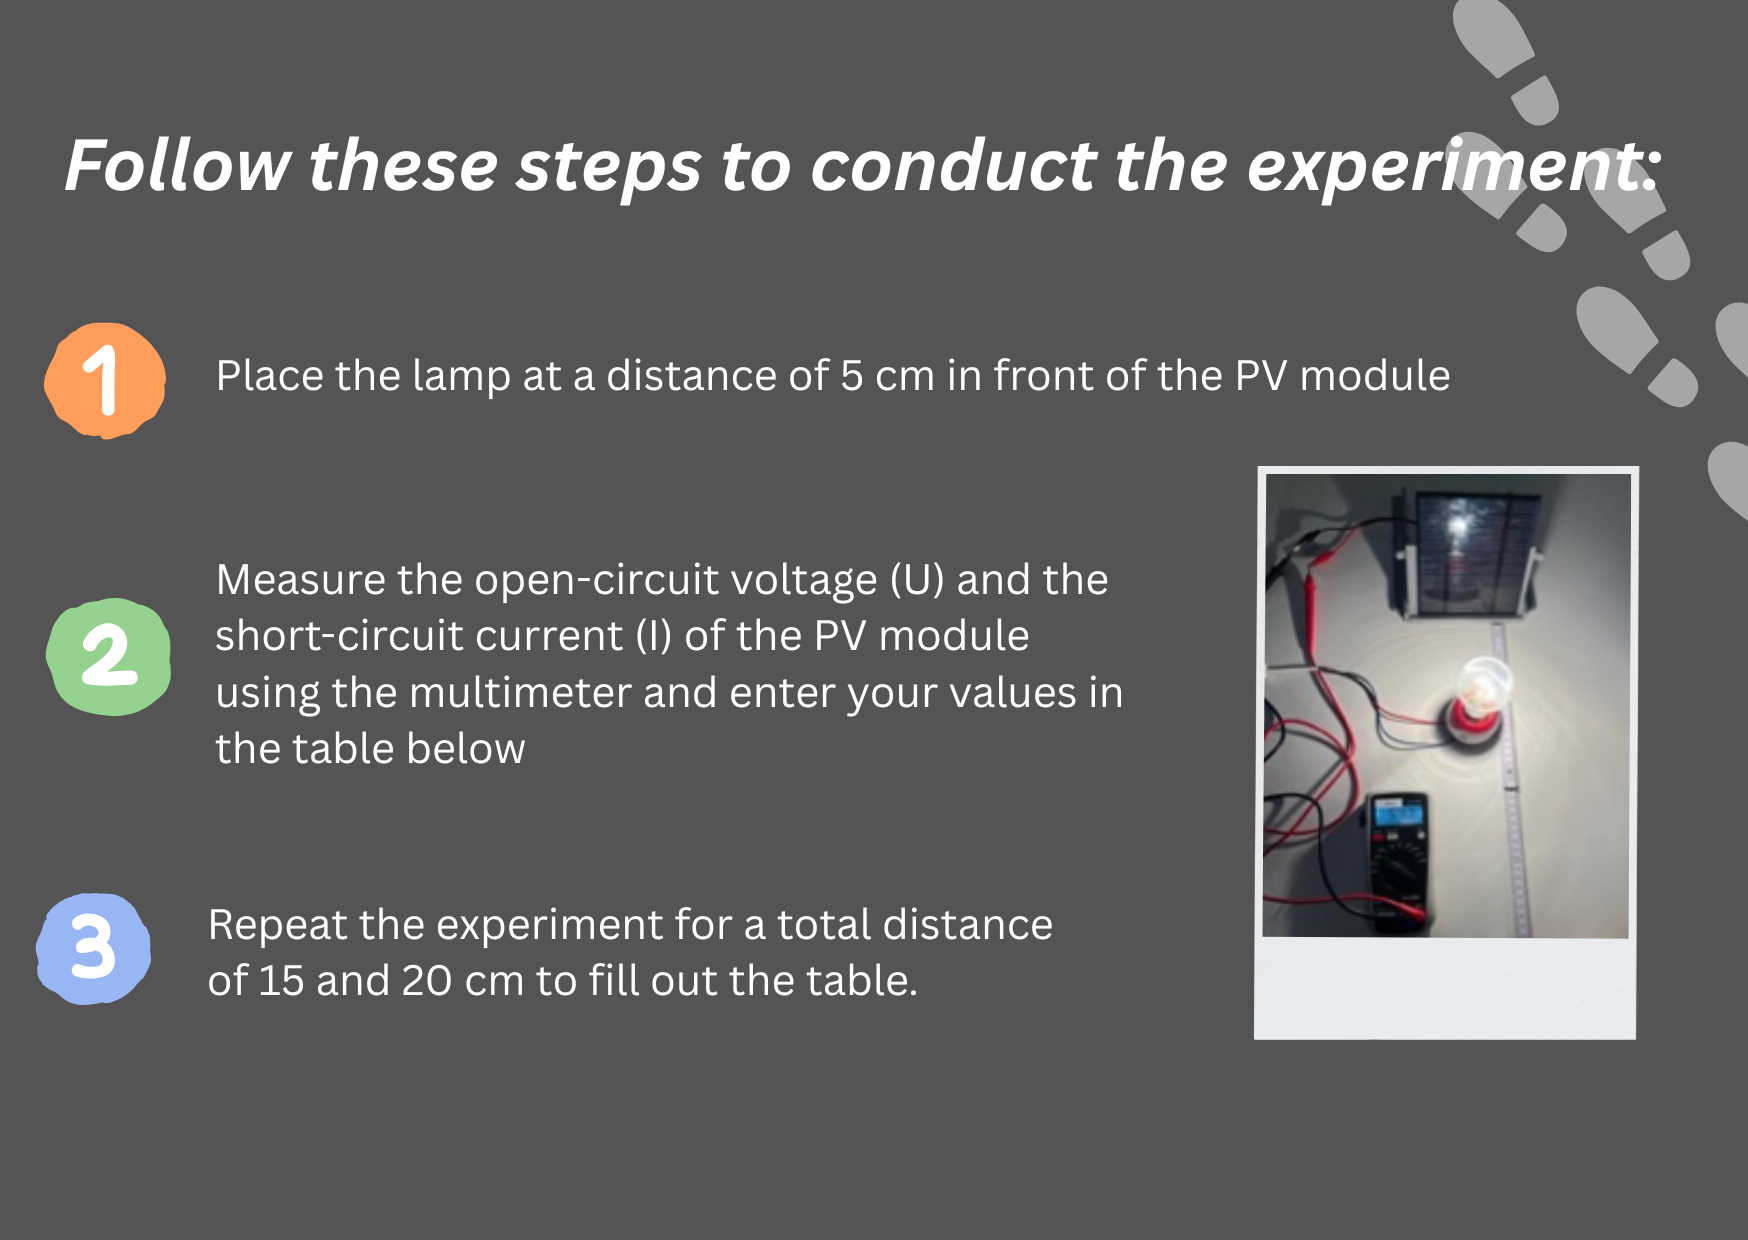
What is the relationship between the distance of the lamp from the PV module and the generated current/voltage?
Task 2:
Discuss your answer with other groups and your teacher.
Task 3:
Fill in the blanks:
🔥 1.4 Impact of Heat on PV Module Performance
In this section, you will investigate how heating influences the performance of PV modules.
🔬 Experiment
Materials needed:
- One lamp (yellow light bulb)
- PV modules (small or big)
- Multimeter
- Meter rule
- Holder for PV panels
📝 Exercise
Task 1:
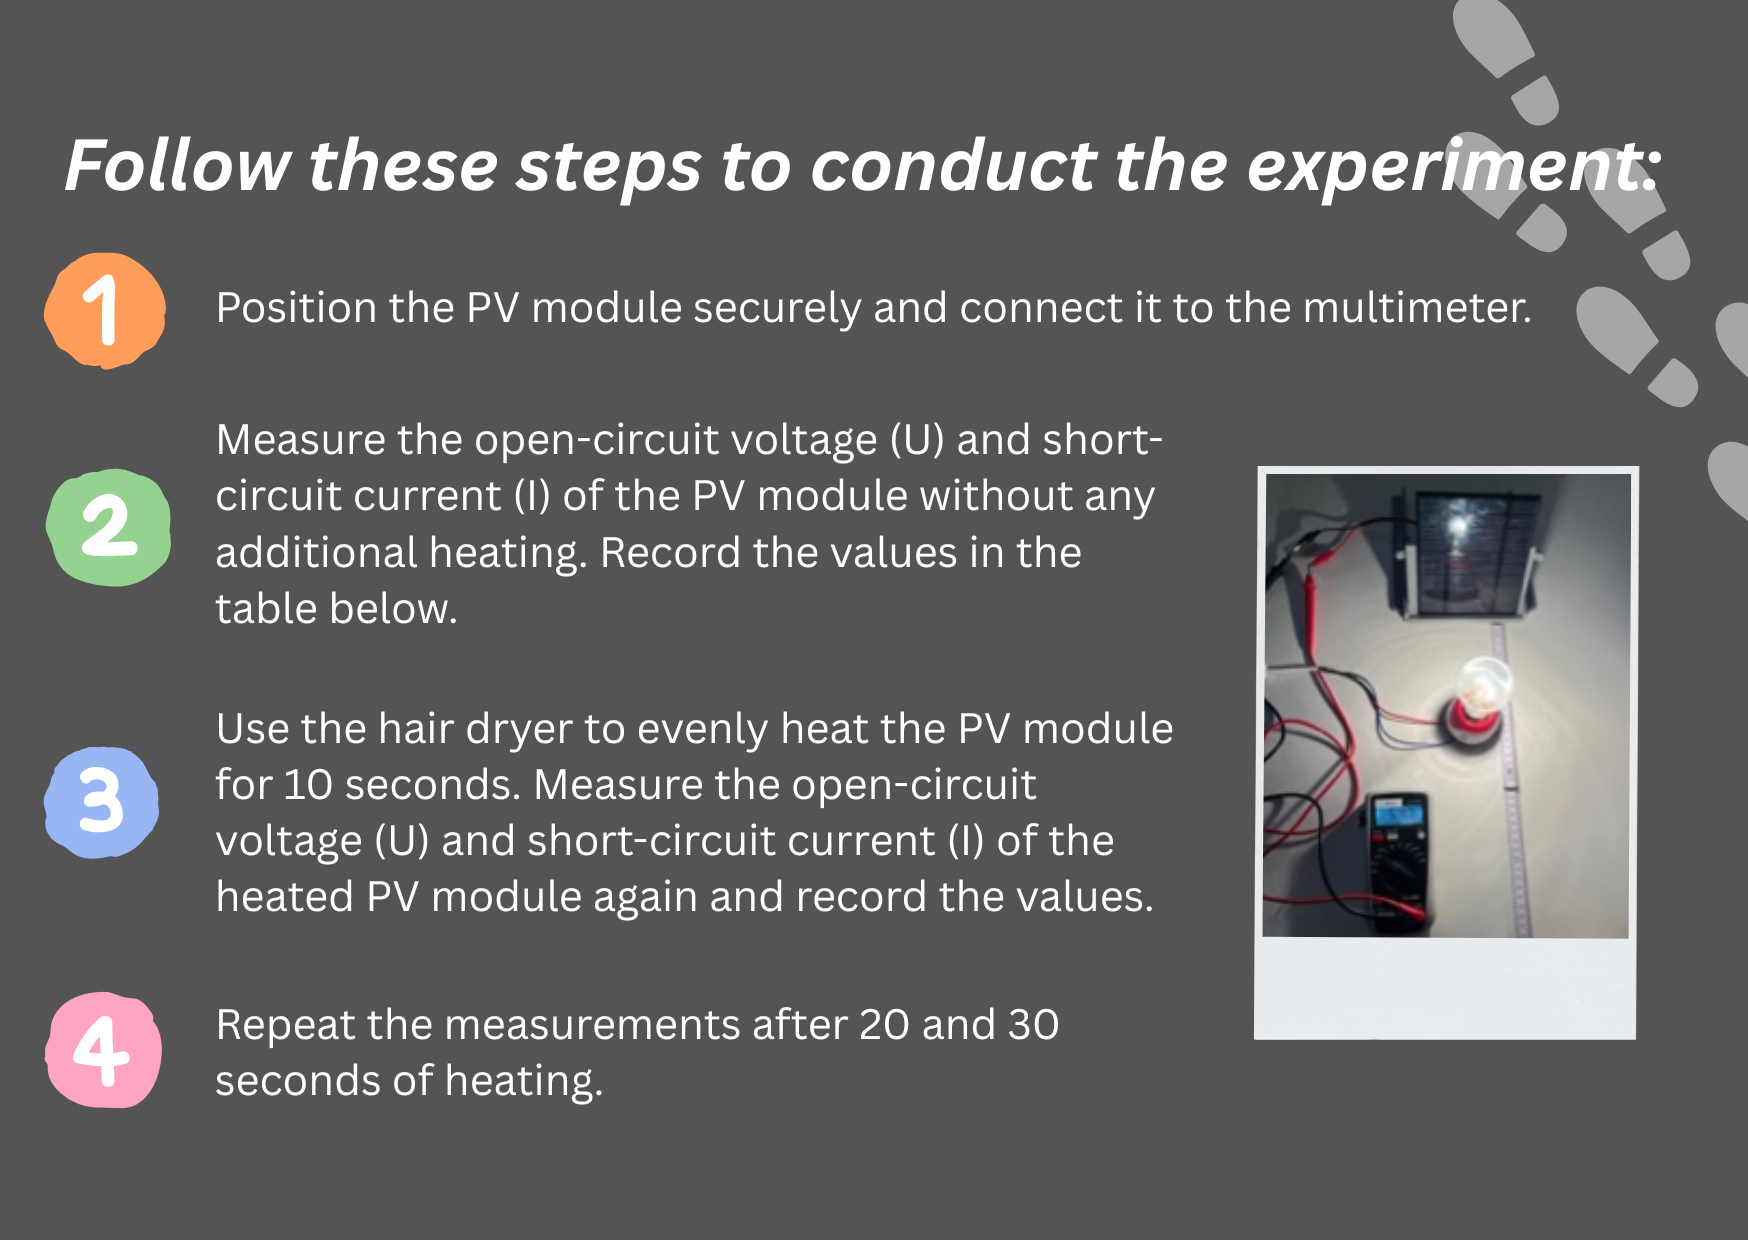
How does the performance of the PV module change when it is heated?
Discuss with your partner: What would be the best location in the world for installing PV systems?
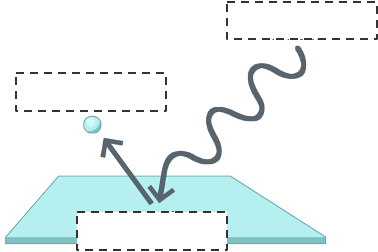
PV cells use the photoelectric effect to convert light energy into electricity. This effect is the key to transforming sunlight into usable electrical energy.
Task 2:
What is the photoelectric effect? Fill in the missing terms in your worksheet using: Photon, Electron, Metal.
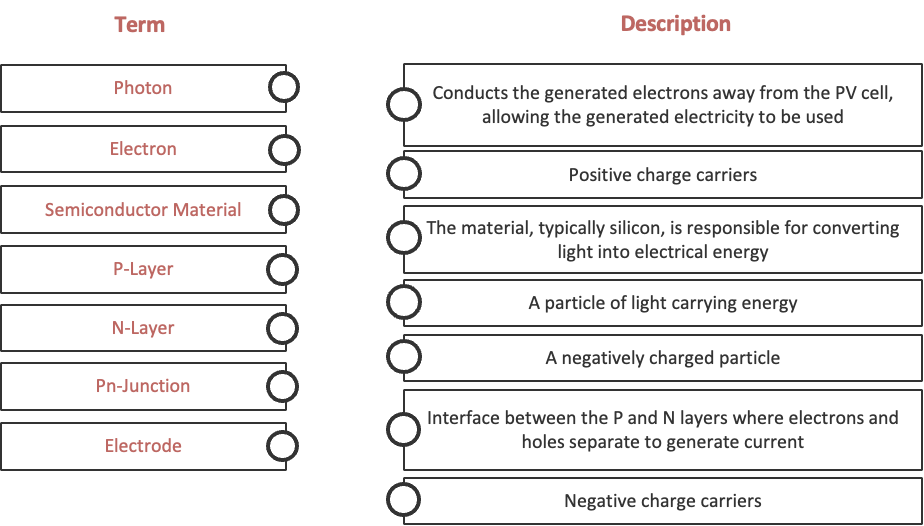
Task 3:
Match the following terms with their descriptions.
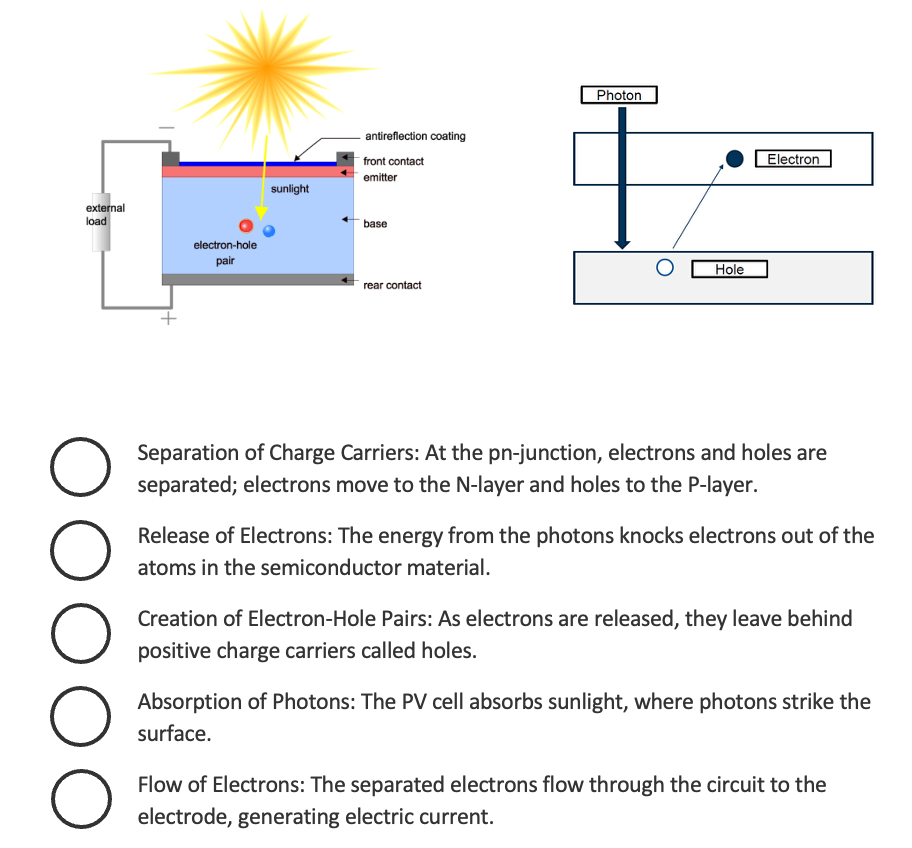
Task 4:
The statements below describe the PV power generation process. Number them in the correct order (1–5).
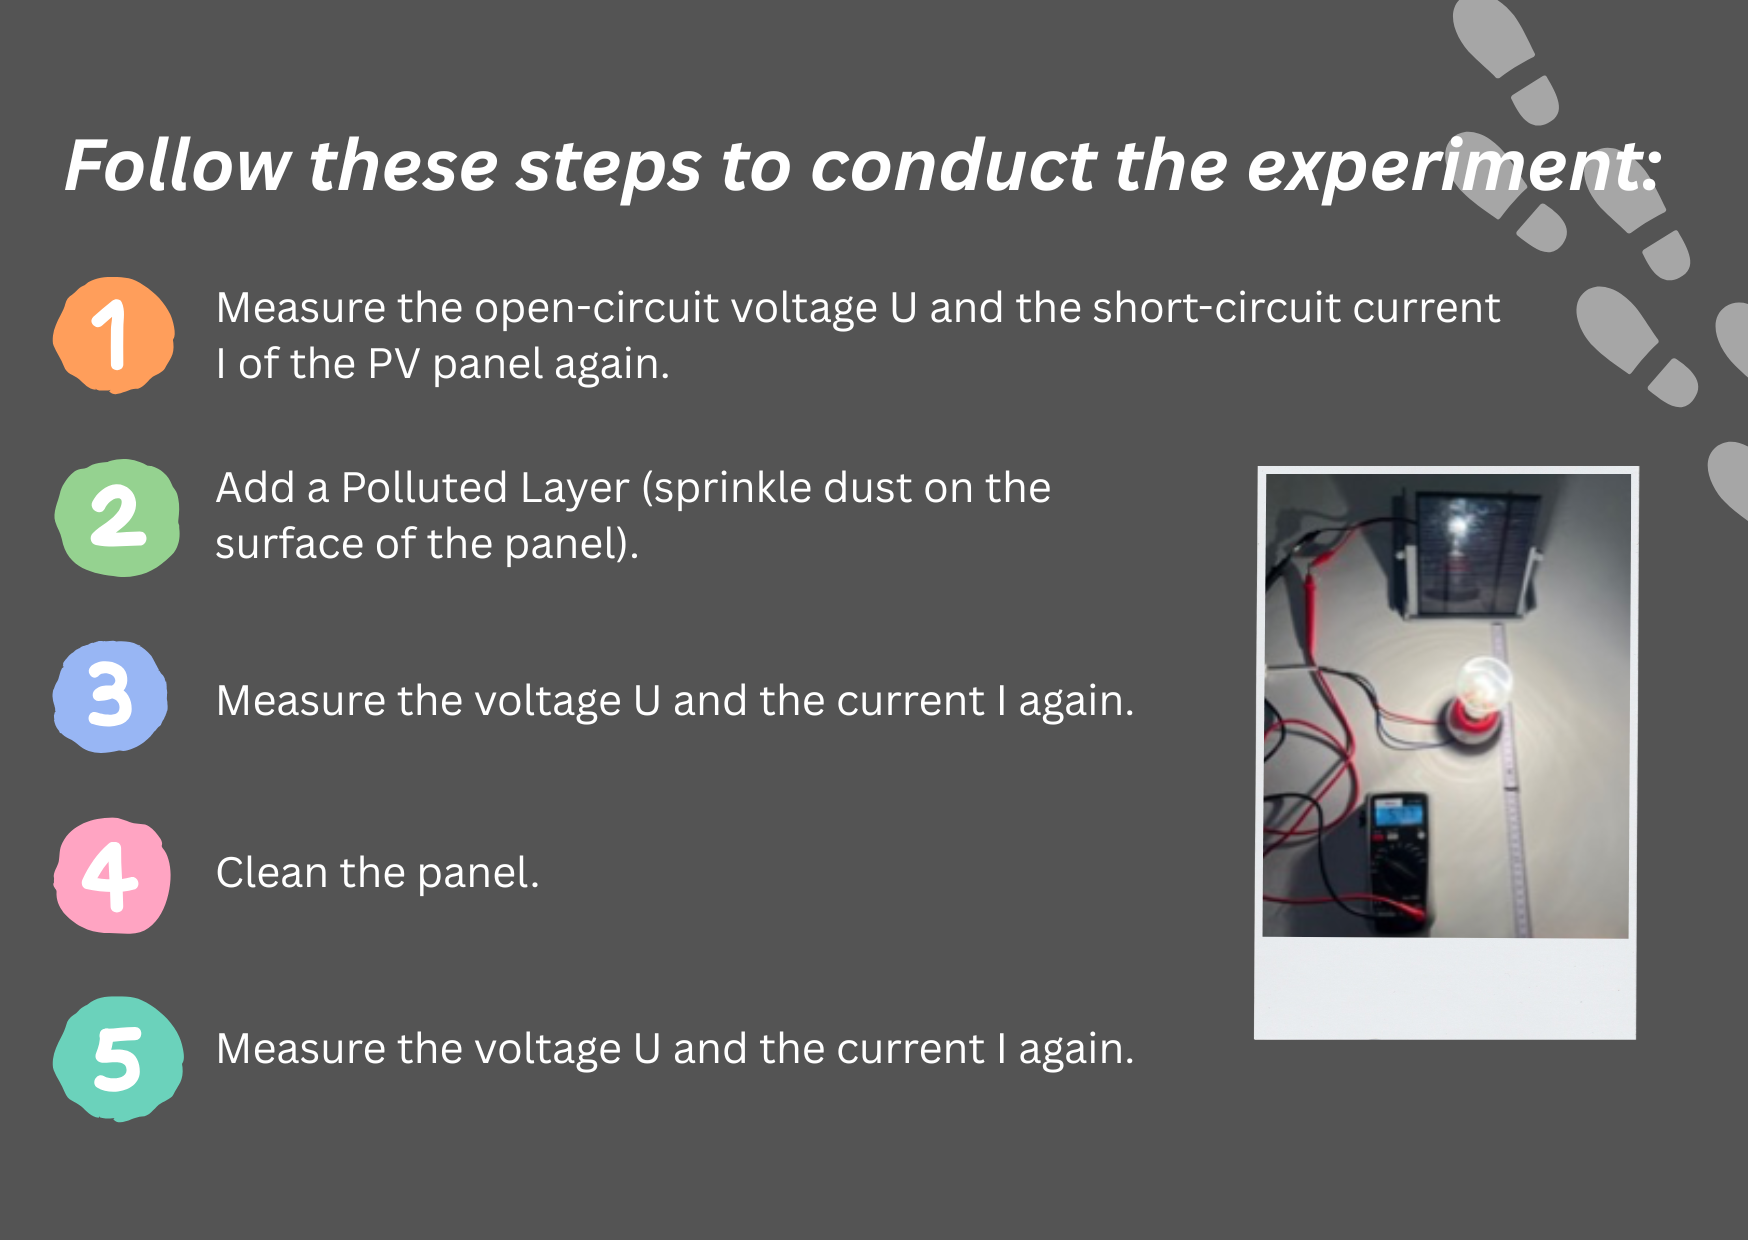
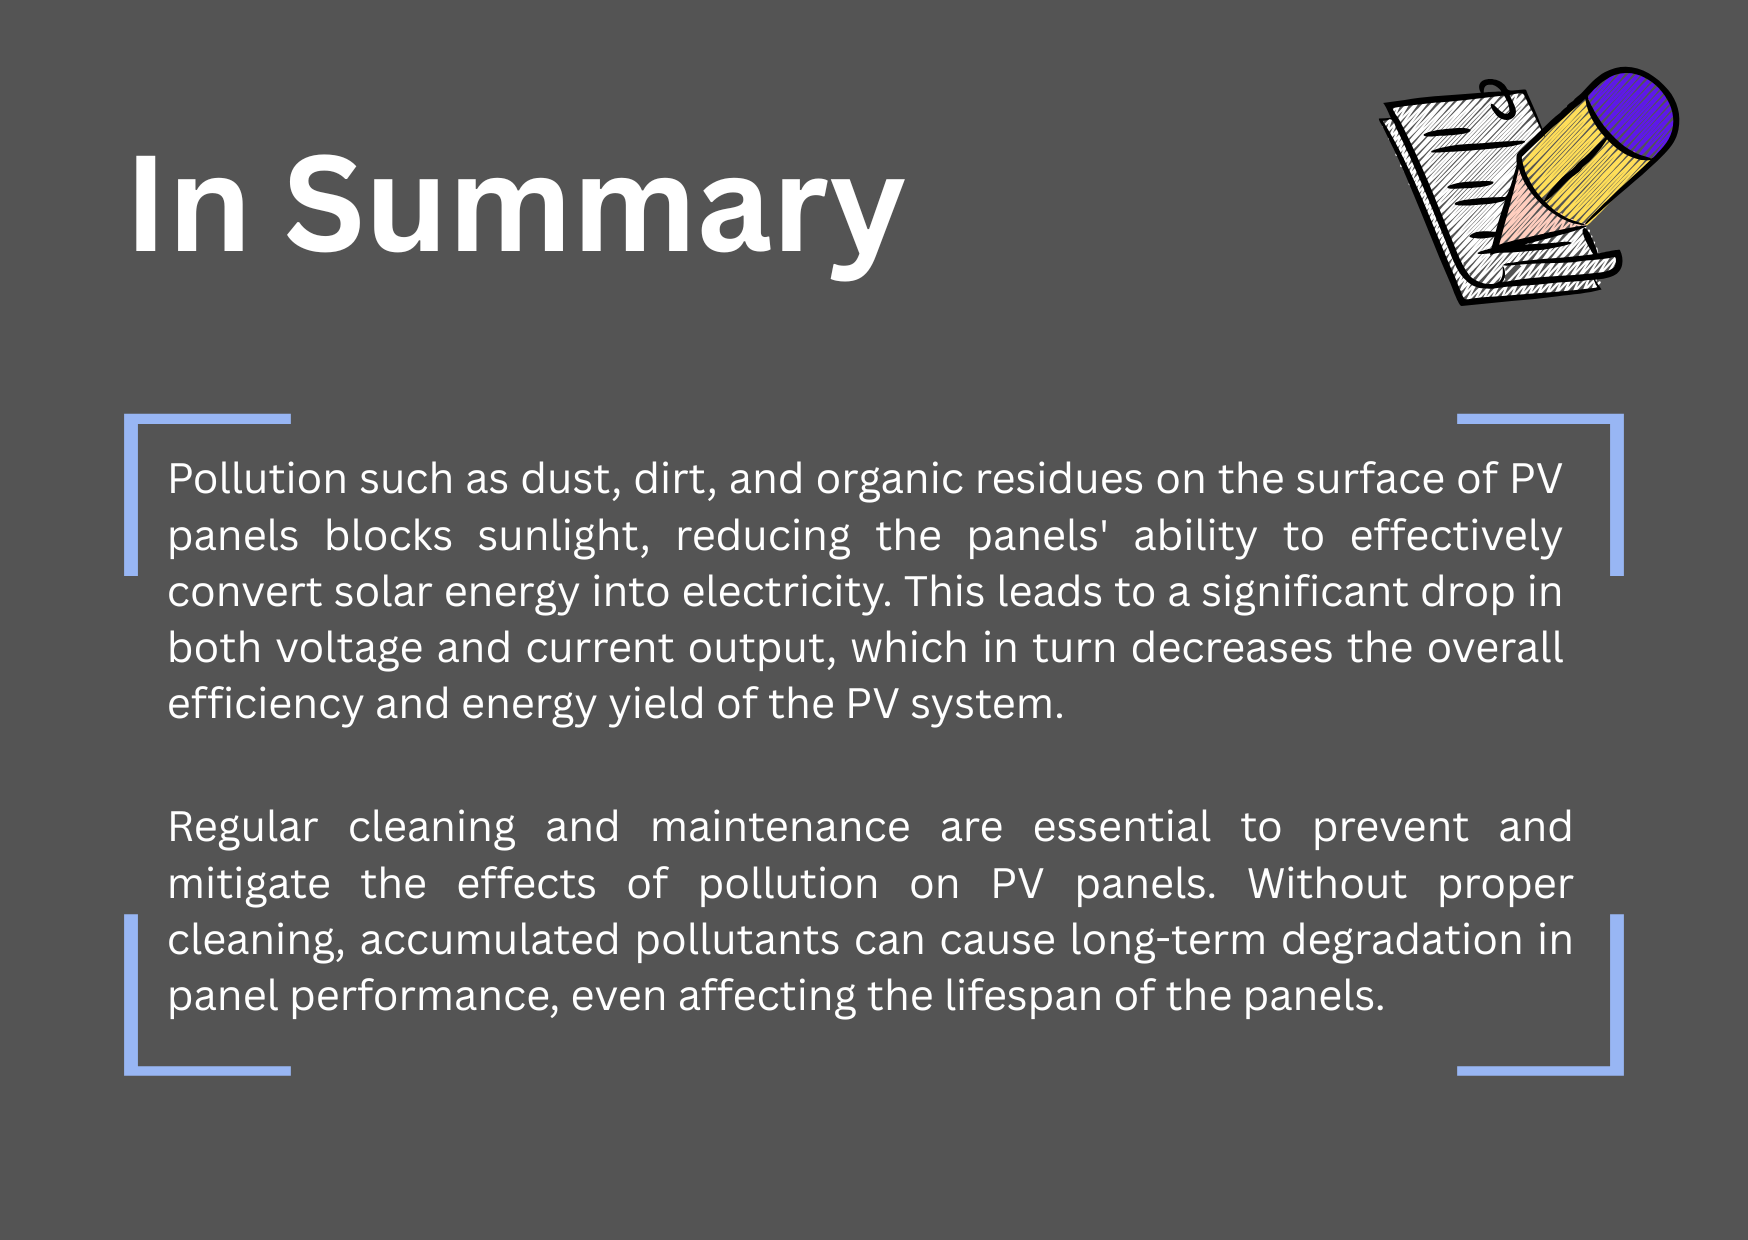
🧼 1.5 Impact of Pollution on PV Module Performance
In this section, you will explore how pollution affects the output of PV panels. Dirt, dust, or smog can block sunlight and reduce energy production.
🔬 Experiment
Materials needed:
- One lamp (yellow light bulb)
- PV modules (small or big)
- Multimeter
- Meter rule
- Holder for PV panels
📝 Exercise
Task 1:
How did the voltage and the current change? What effect did cleaning have on the panel’s performance?
Task 2:
What can be some strategies to keep PV panels functioning optimally?
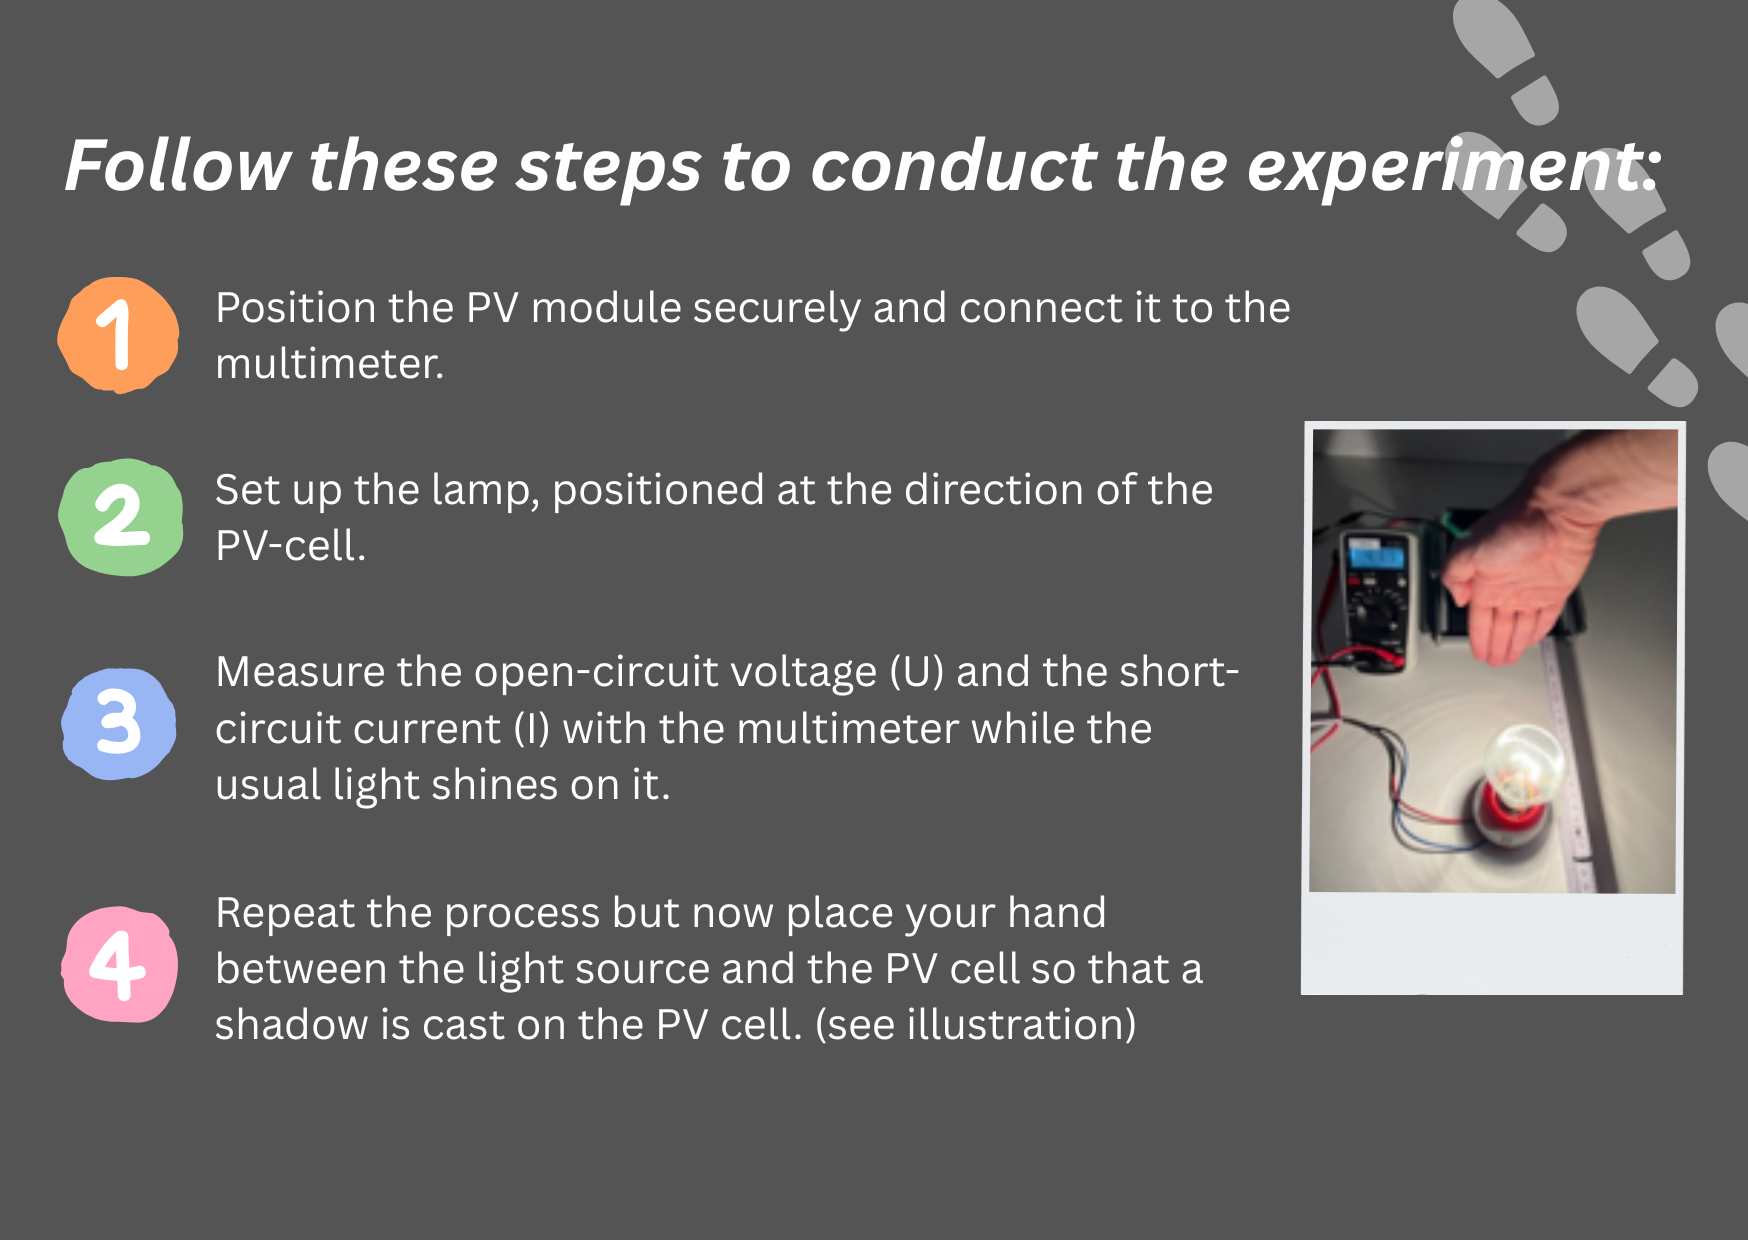
🌑 1.6 Impact of Shadows on PV Module Performance
Shadows from trees, buildings, or clouds can significantly affect the power output of PV panels. This section explores just how impactful that can be.
🔬 Experiment
Materials needed:
- One lamp (yellow light bulb)
- PV modules (small or big)
- Multimeter
- Holder for PV panels
📝 Exercise
Task 1:
How did the voltage and the current change? What effect did shadows have on the performance?
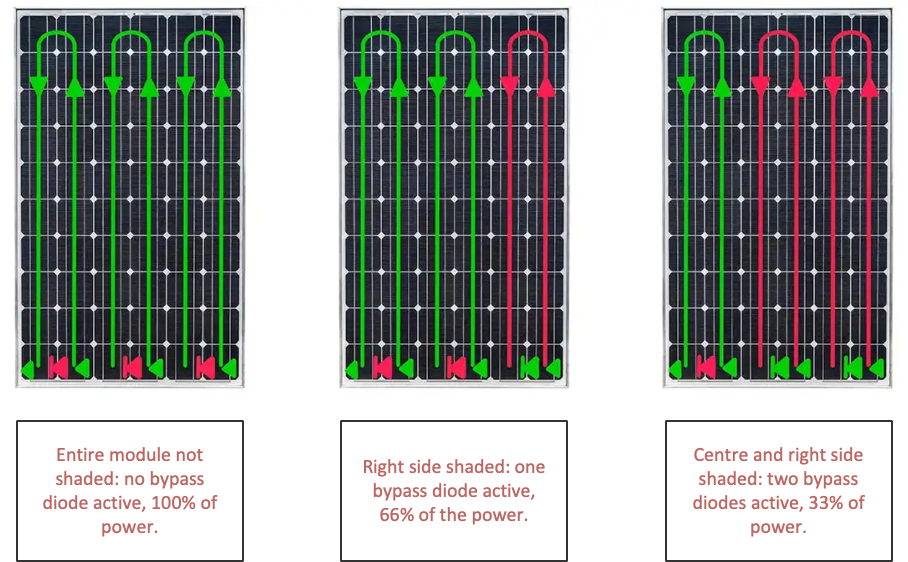
Shadows reduce the sunlight reaching PV cells, which lowers energy output significantly—even if only part of the panel is shaded.
To prevent the negative effects of shading, bypass diodes are used. A bypass diode is an essential component in solar modules. It acts as a protective mechanism by diverting the current flow around solar cells or module sections with lower performance. This enables a better power yield from the remaining cells and increases the reliability and efficiency of the entire solar module. Thanks to the bypass diodes, solar modules can achieve high performance even when they are in the shade or shadow.
Task 2:
What strategies could help avoid or reduce shading on PV panels?
📗 Chapter 2 – Connecting PV to a Load and MPP
In this chapter, you will learn about:
- PV panels in Series
- PV panels in Parallel
- Fixed load (Resistor)
- Changing load
- Local conditions and load changes
🎯 Learning Objective
- Understand how connecting PV panels in series or parallel influences voltage and current.
- Evaluate how different configurations affect overall system voltage, current, and power output.
- Manage the impact of both fixed and variable loads on PV system performance.
- Apply Maximum Power Point (MPP) tracking to optimize the energy output from PV panels.
- Adapt to local environmental conditions to maximize the efficiency of your PV system.
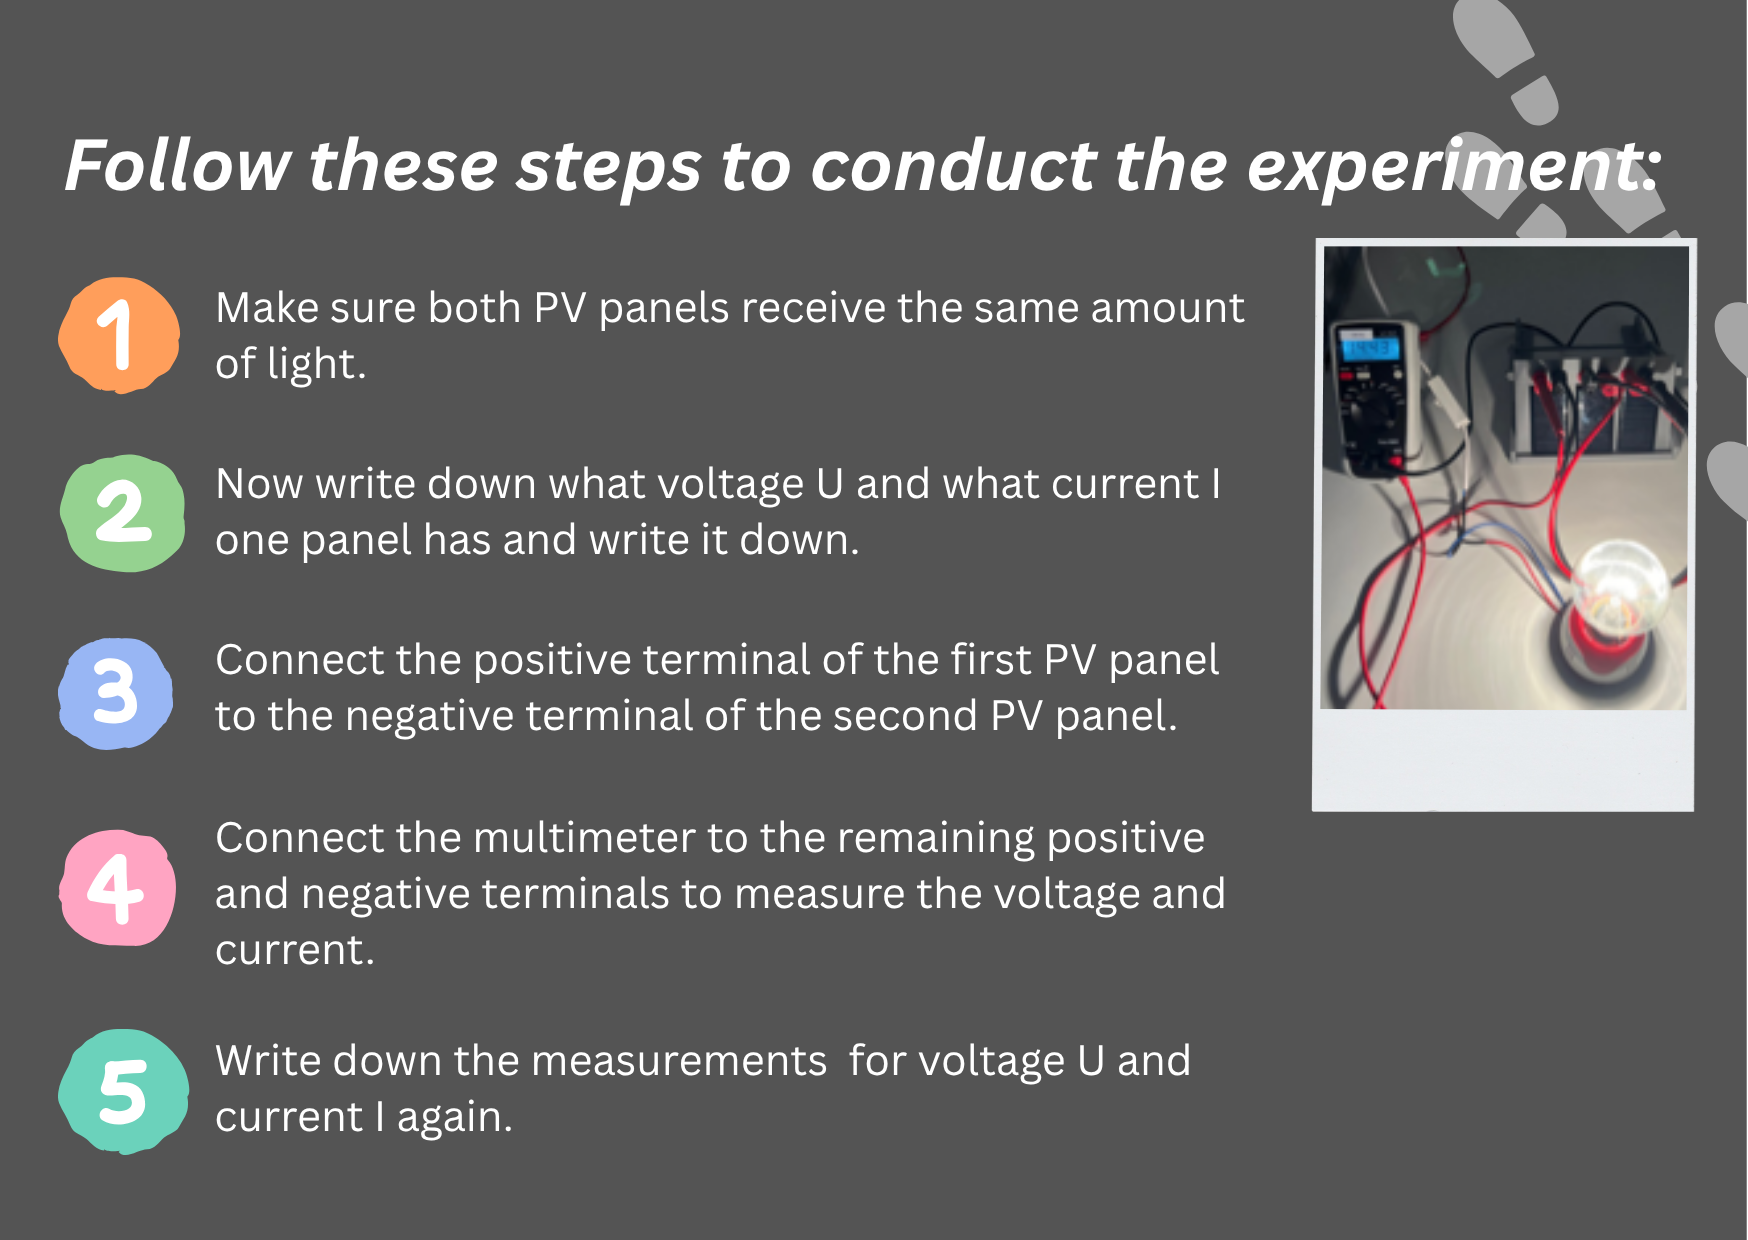
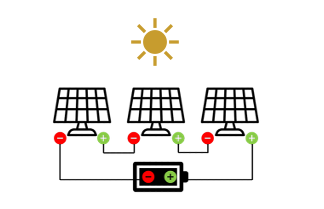
🔗 2.1 PV Panels in Series
In this section, you will understand the effect of connecting two PV cells in a series.
🔬 Experiment
Materials needed:
- One lamp (yellow light bulb)
- PV modules (small)
- Multimeter
- Various cables
- Holder for PV panels
📝 Exercise
Task 1:
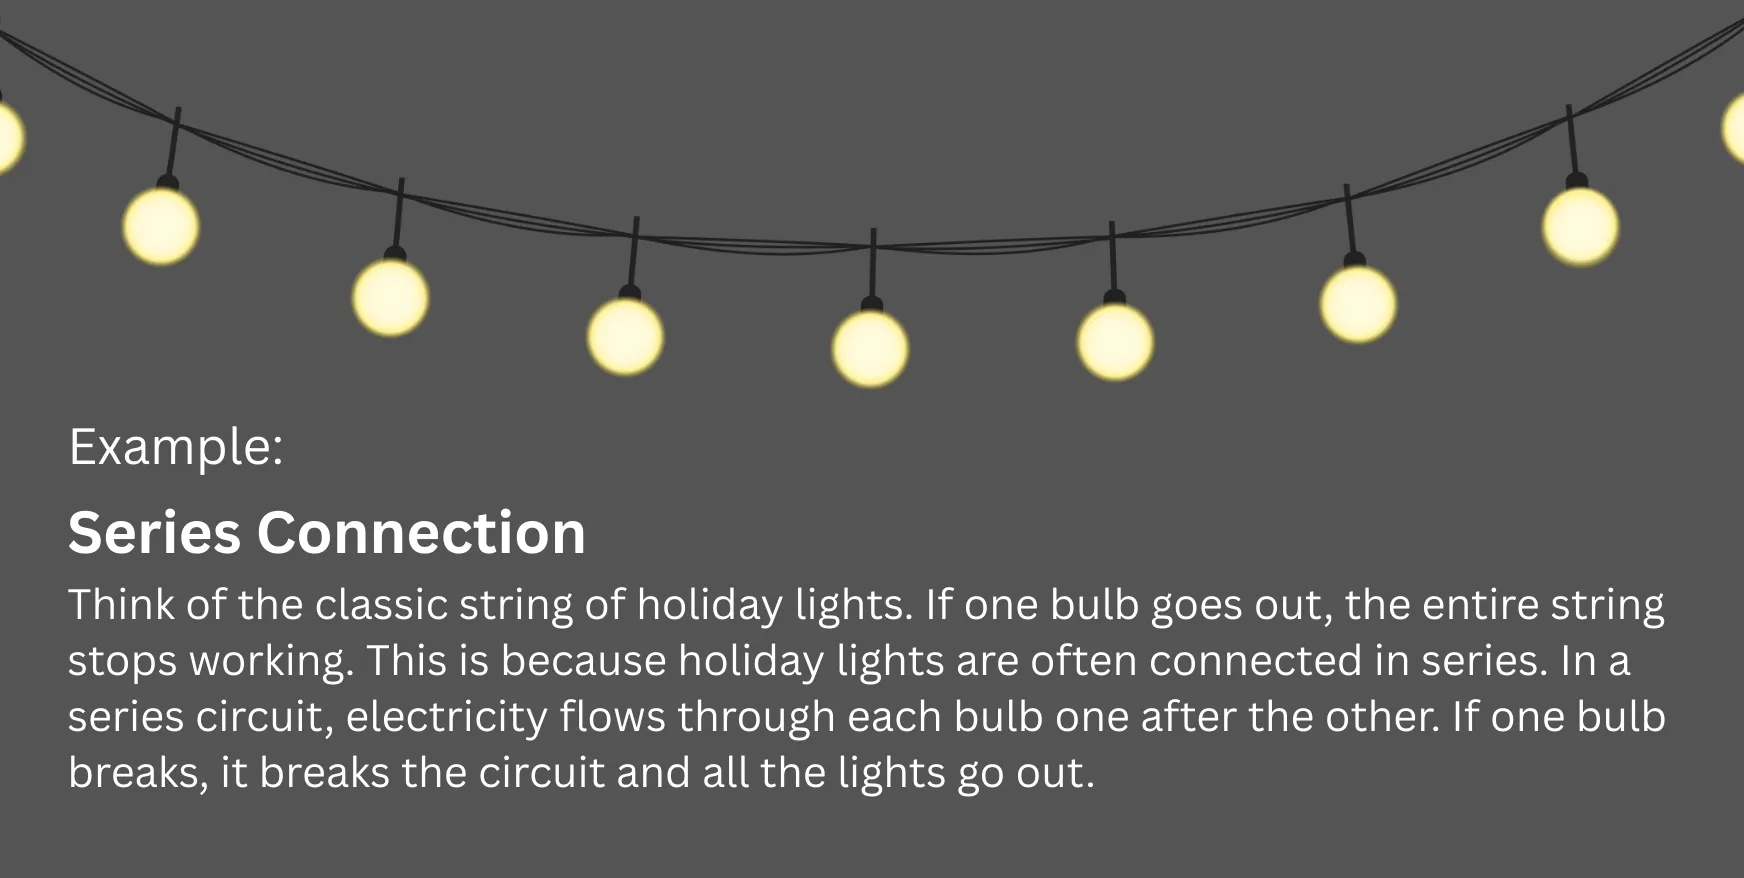
Discuss with others in the room (maybe stand up and talk to different people in the class). What are the PROS and CONS of series connection?

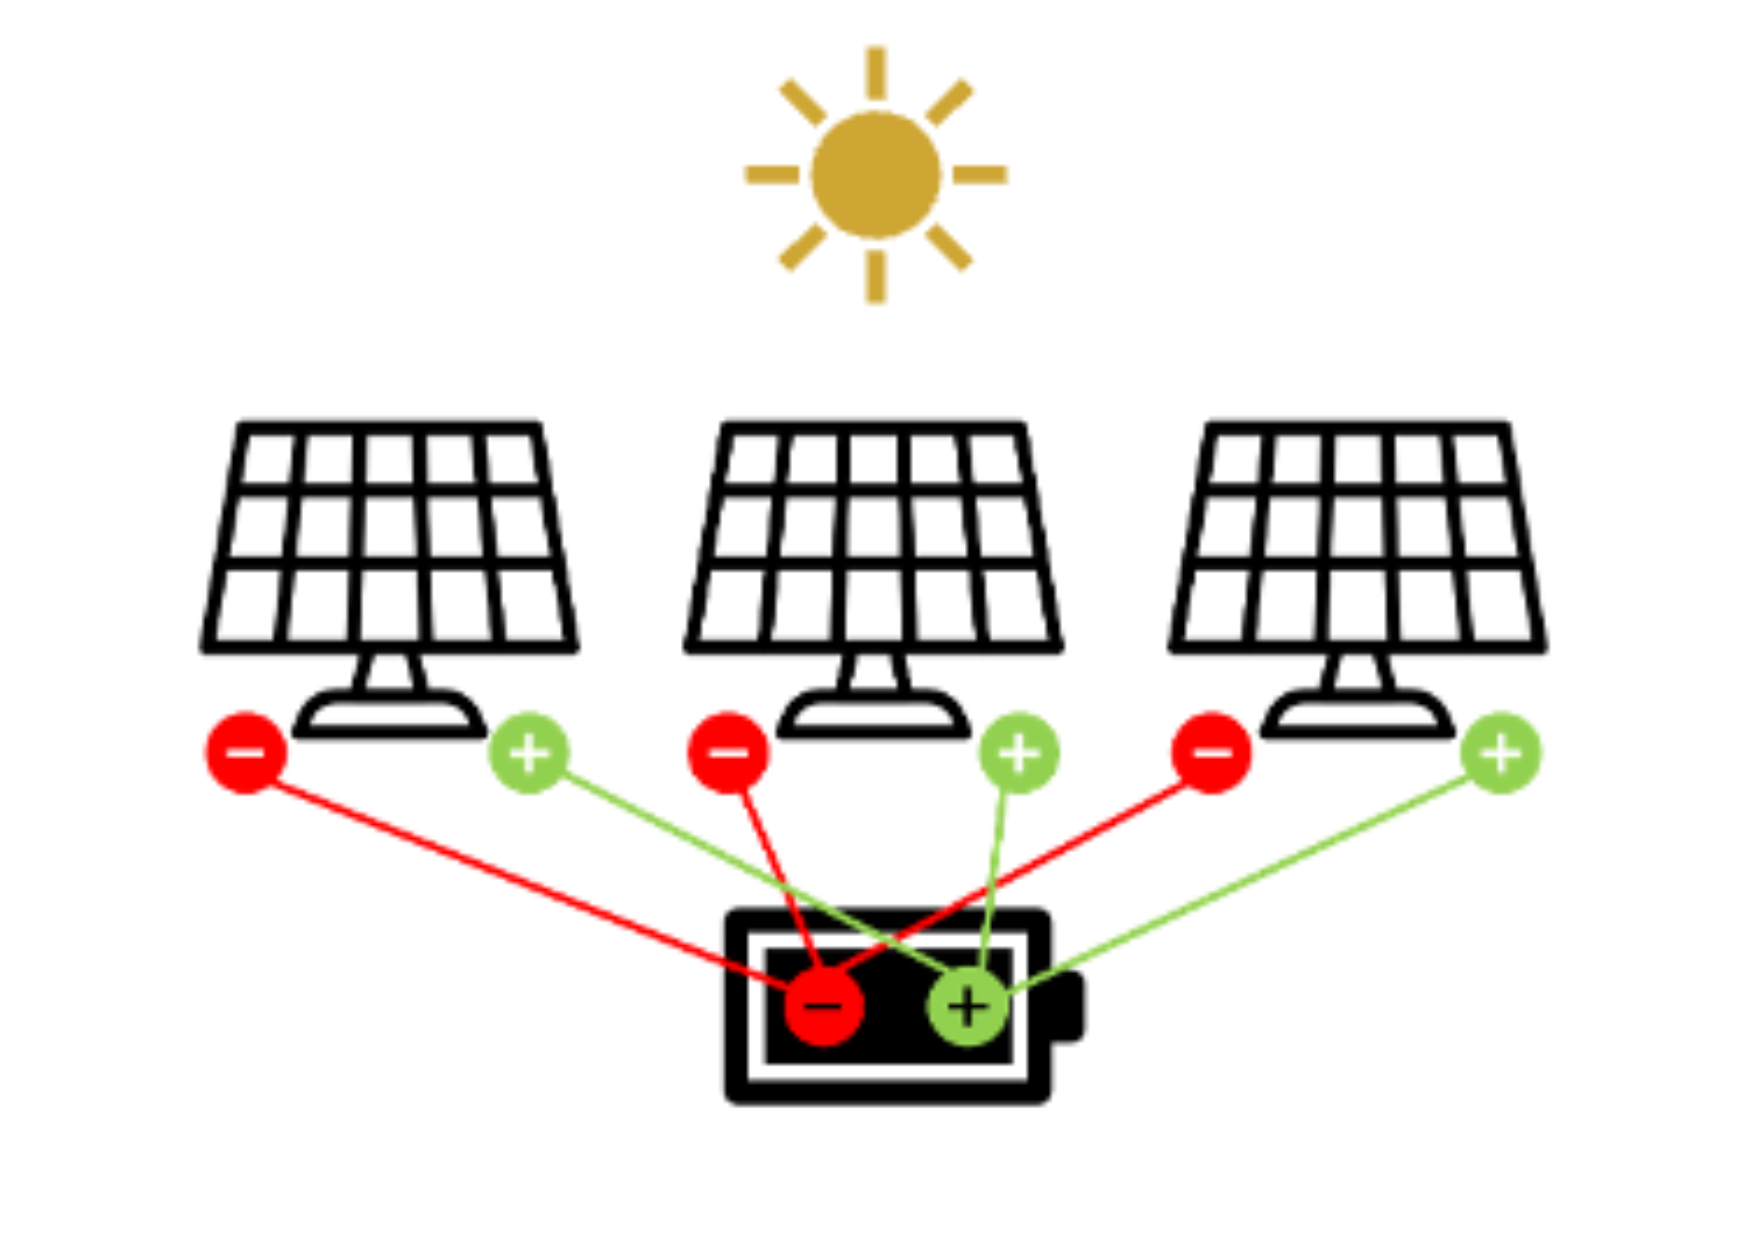
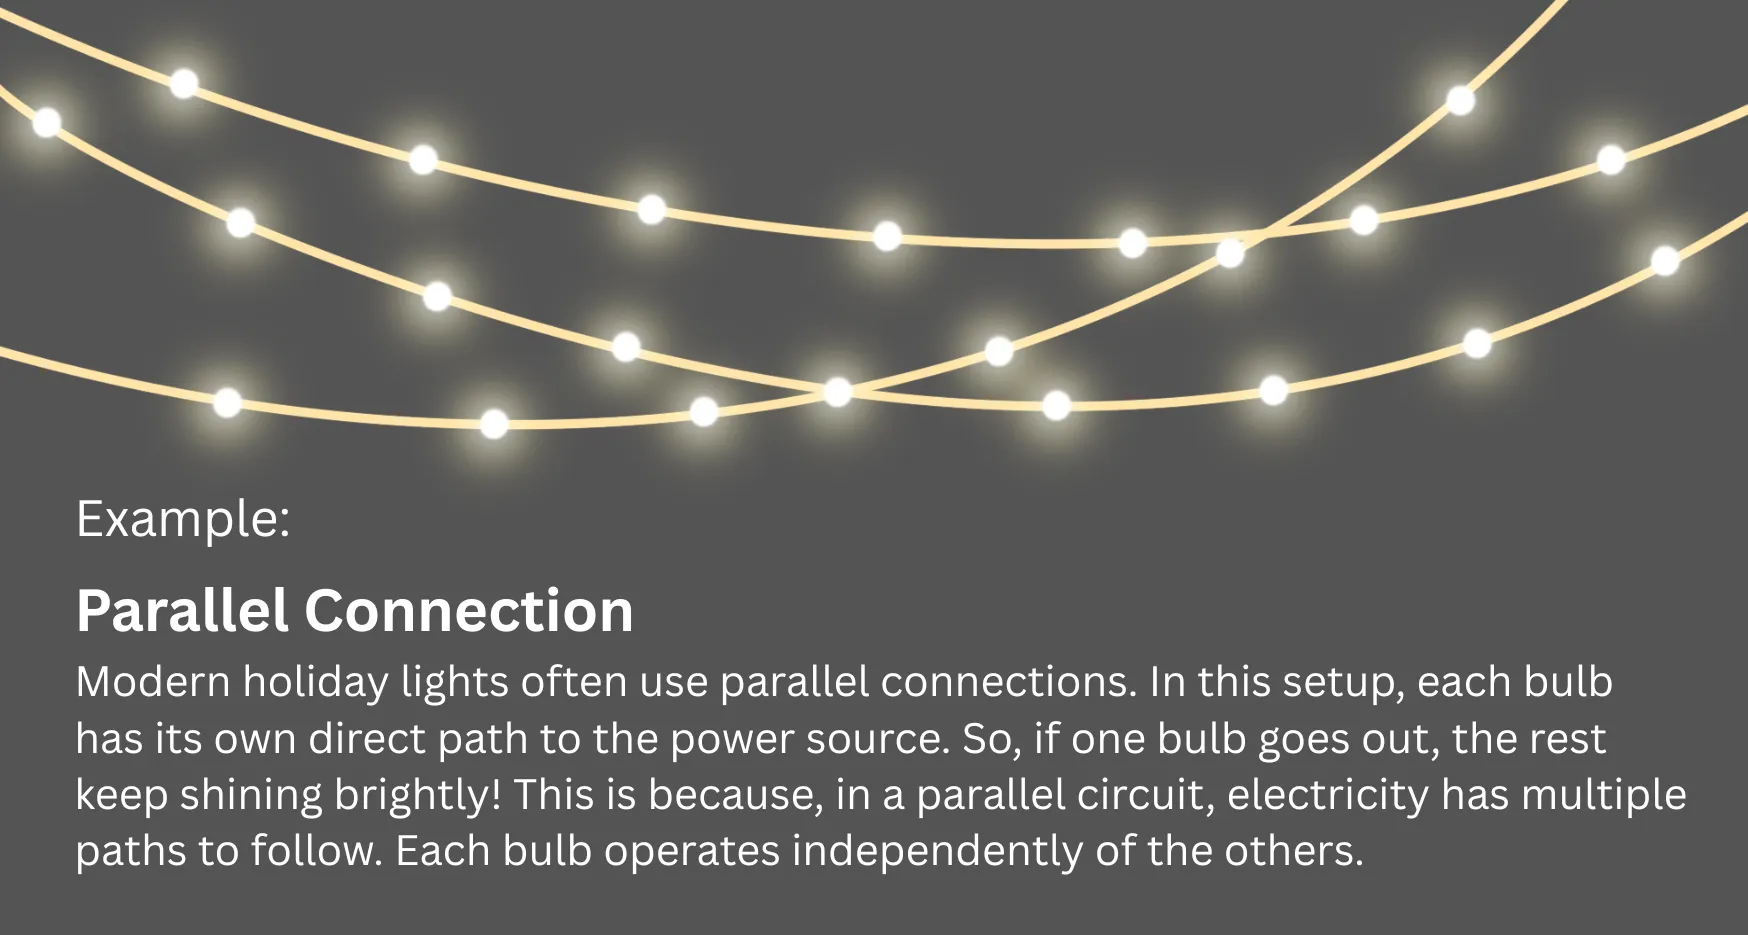
🔗 2.2 PV Panels in Parallel
In this section, you will understand the effect of connecting two PV cells in parallel.
🔬 Experiment
Materials needed:
- One lamp (yellow light bulb)
- PV modules (small)
- Multimeter
- Various cables
- Holder for PV panels
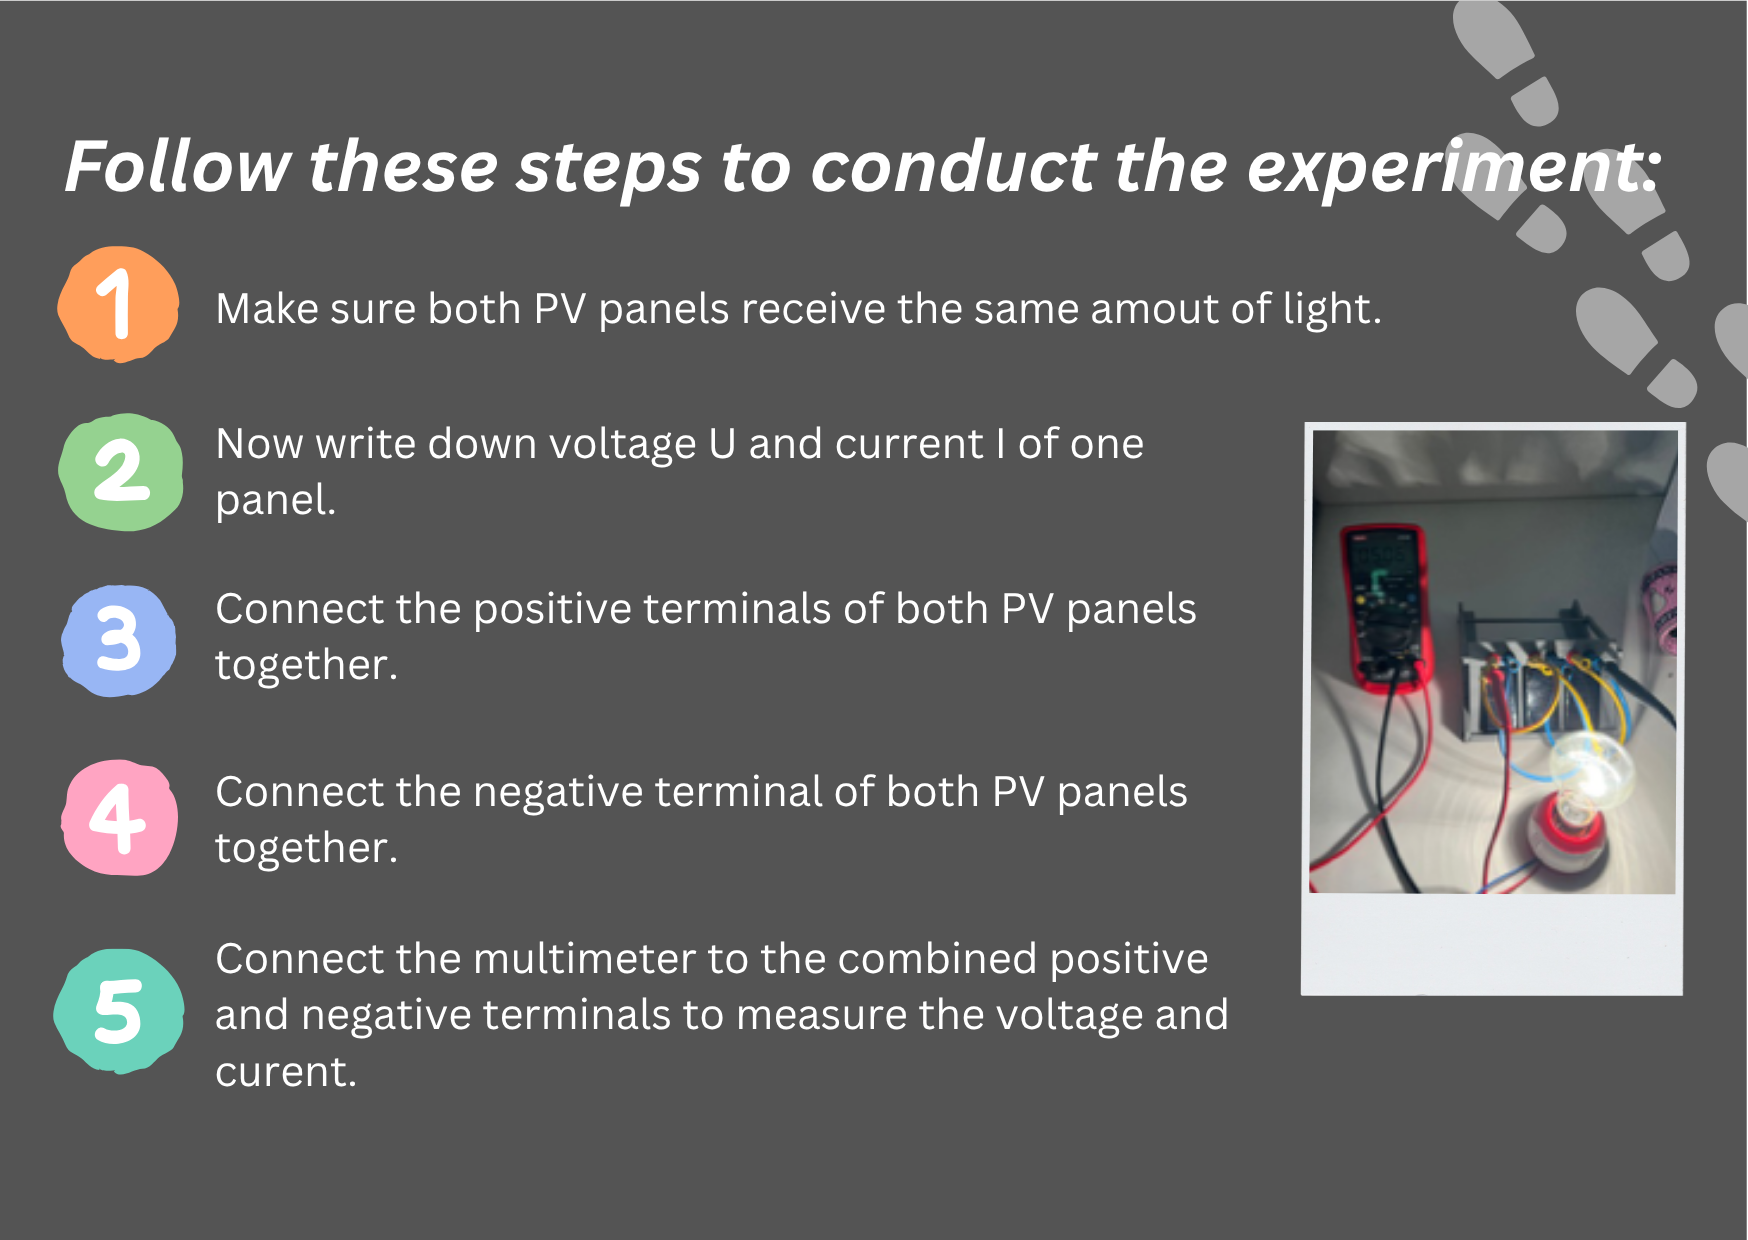
📝 Exercise
When we say, “PVs are current sources”, we mean that PV systems primarily produce a steady flow of current, depending on the available sunlight. Unlike a battery with a fixed voltage, a PV system adjusts its output based on sunlight intensity.
Task 1:
What happens with the current on a sunny day?
What happens with the current on a cloudy day?
Knowing that PVs are current sources helps us design better solar systems. When connecting multiple solar panels, we choose between series or parallel based on whether we need more current or more voltage.
Task 2:
What are the PROS and CONS of parallel connection?
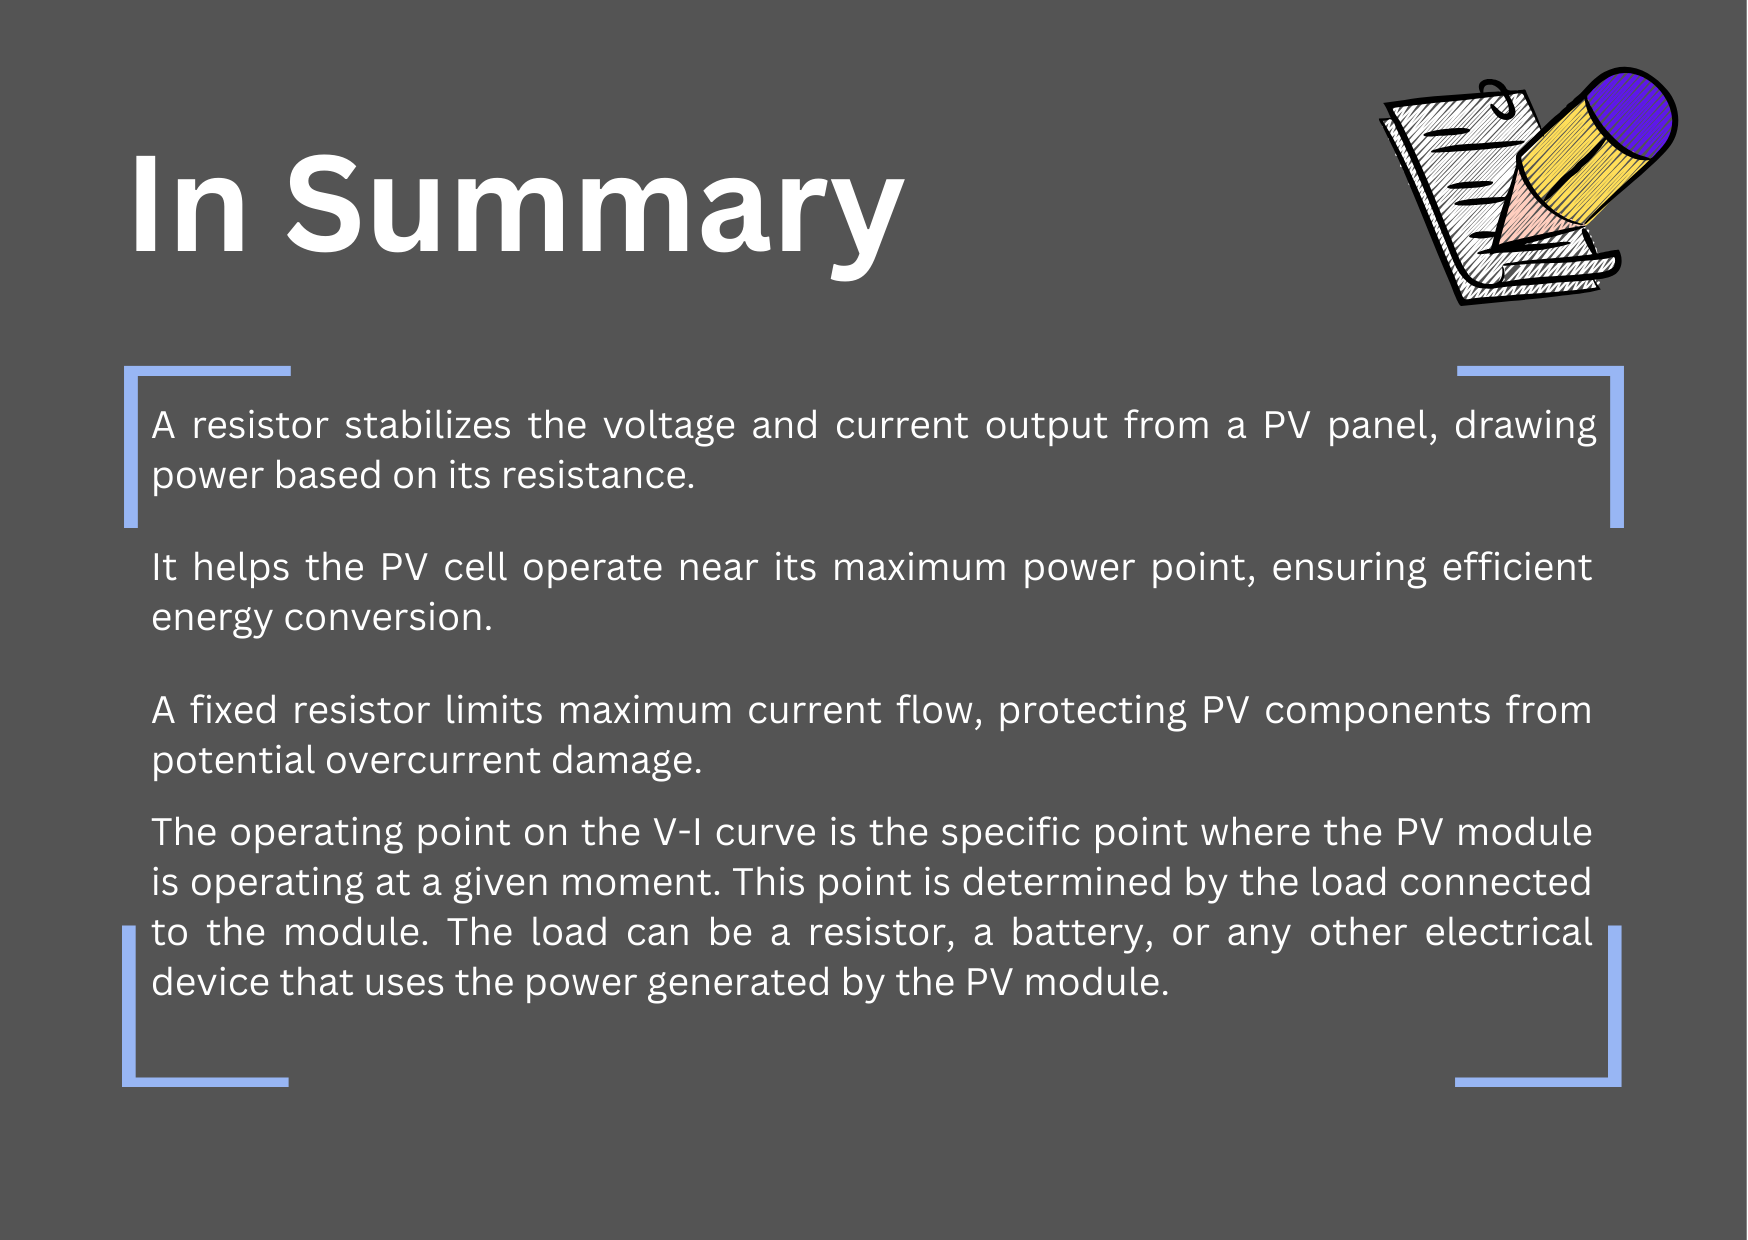
🧱 2.3 Fixed Load (Resistor)
In this section, you will understand how a resistor works when connected to a PV module.
🔬 Experiment
Materials needed:
- One lamp (yellow light bulb)
- PV modules (small or big)
- Multimeter
- Various cables
- Holder for PV panels
- Resistance (Potentiometer)
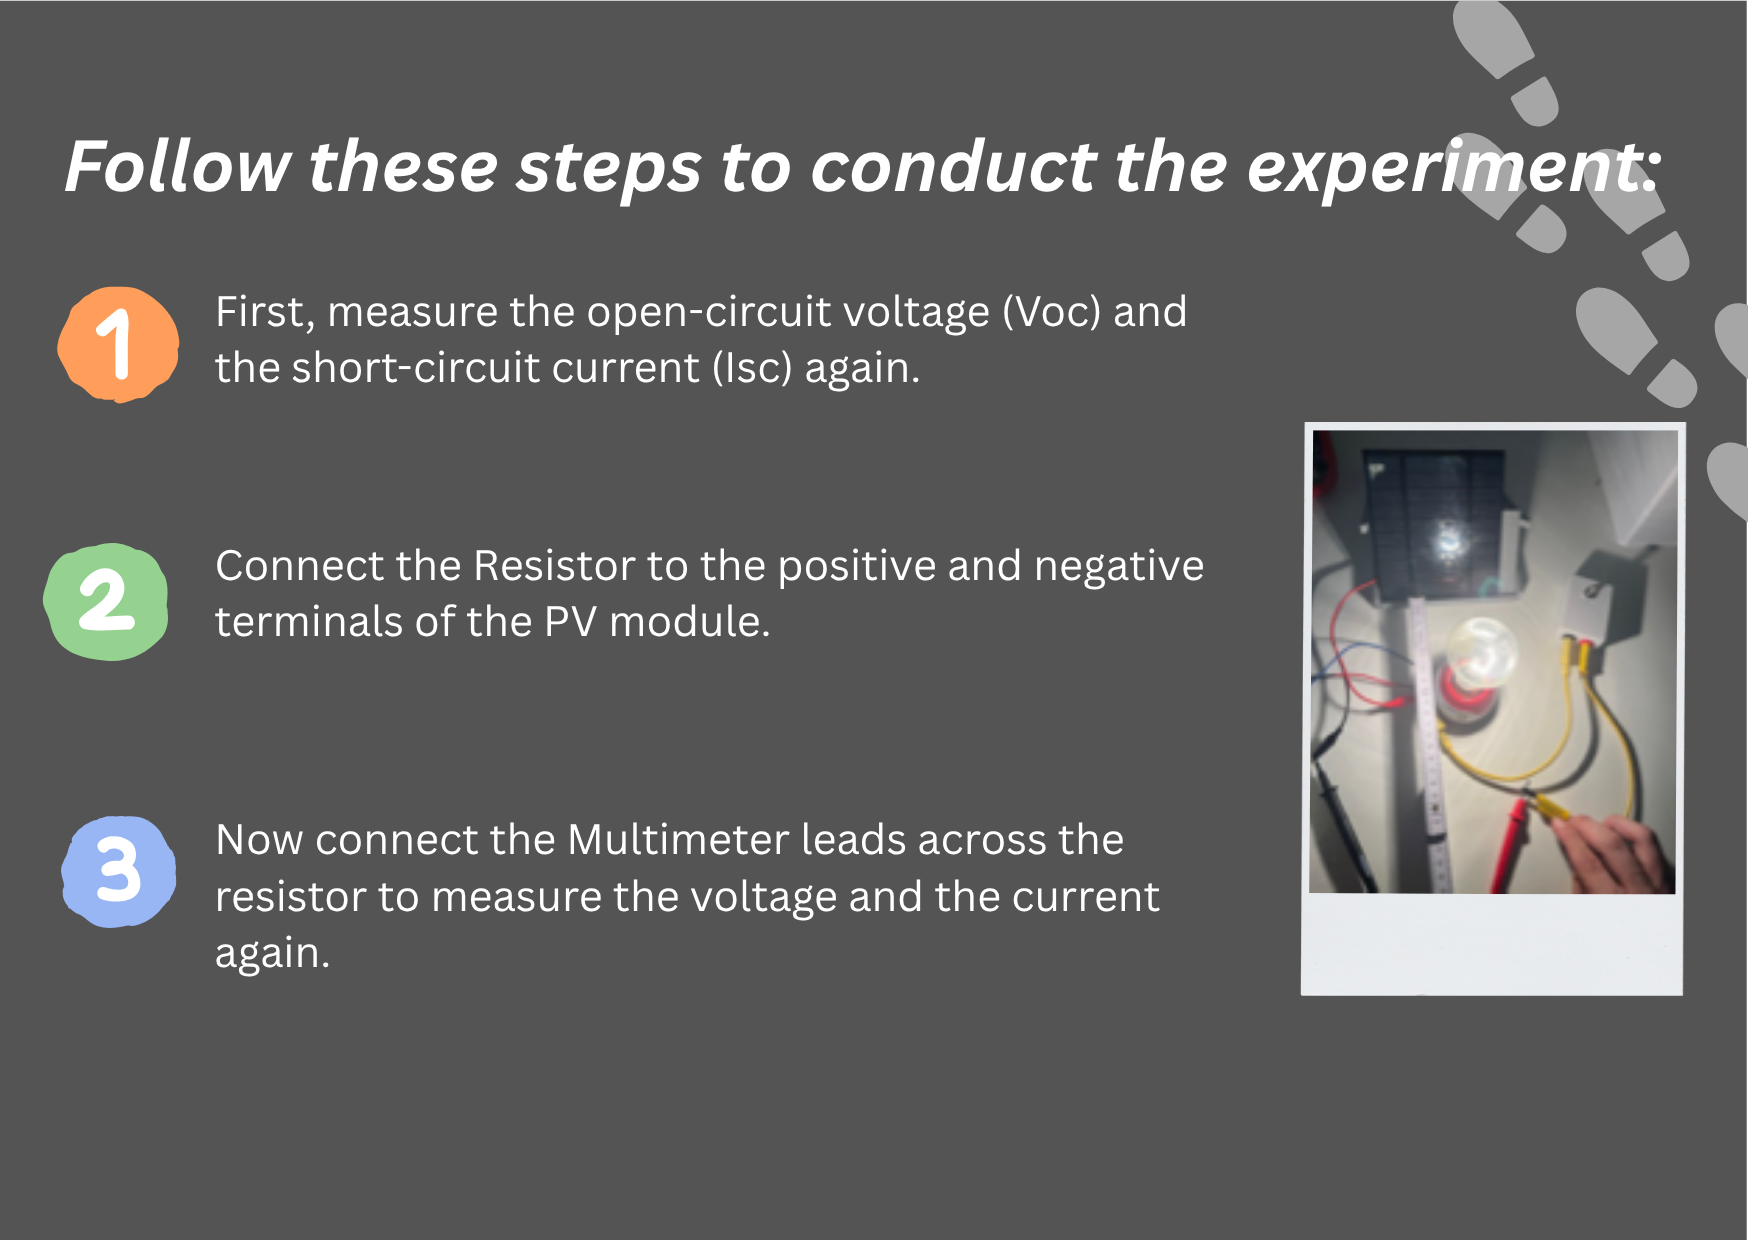
📝 Exercise
Task 1:
How did the voltage and current change when the resistor was connected?
Please draw a graph with the voltage (V) on the X-axis and the current (A) on the Y-axis.
Insert your measured values as points on the graph.
Example: Resistor P → (Voltage / Current)
🔄 2.4 Changing Load
This section explores how changing the resistance affects the PV system’s performance and the operating point on the V-I curve.
🔬 Experiment
Materials needed:
- One lamp (yellow light bulb)
- PV modules (small or big)
- Multimeter
- Various cables
- Holder for PV panels
- Resistance (Potentiometer)
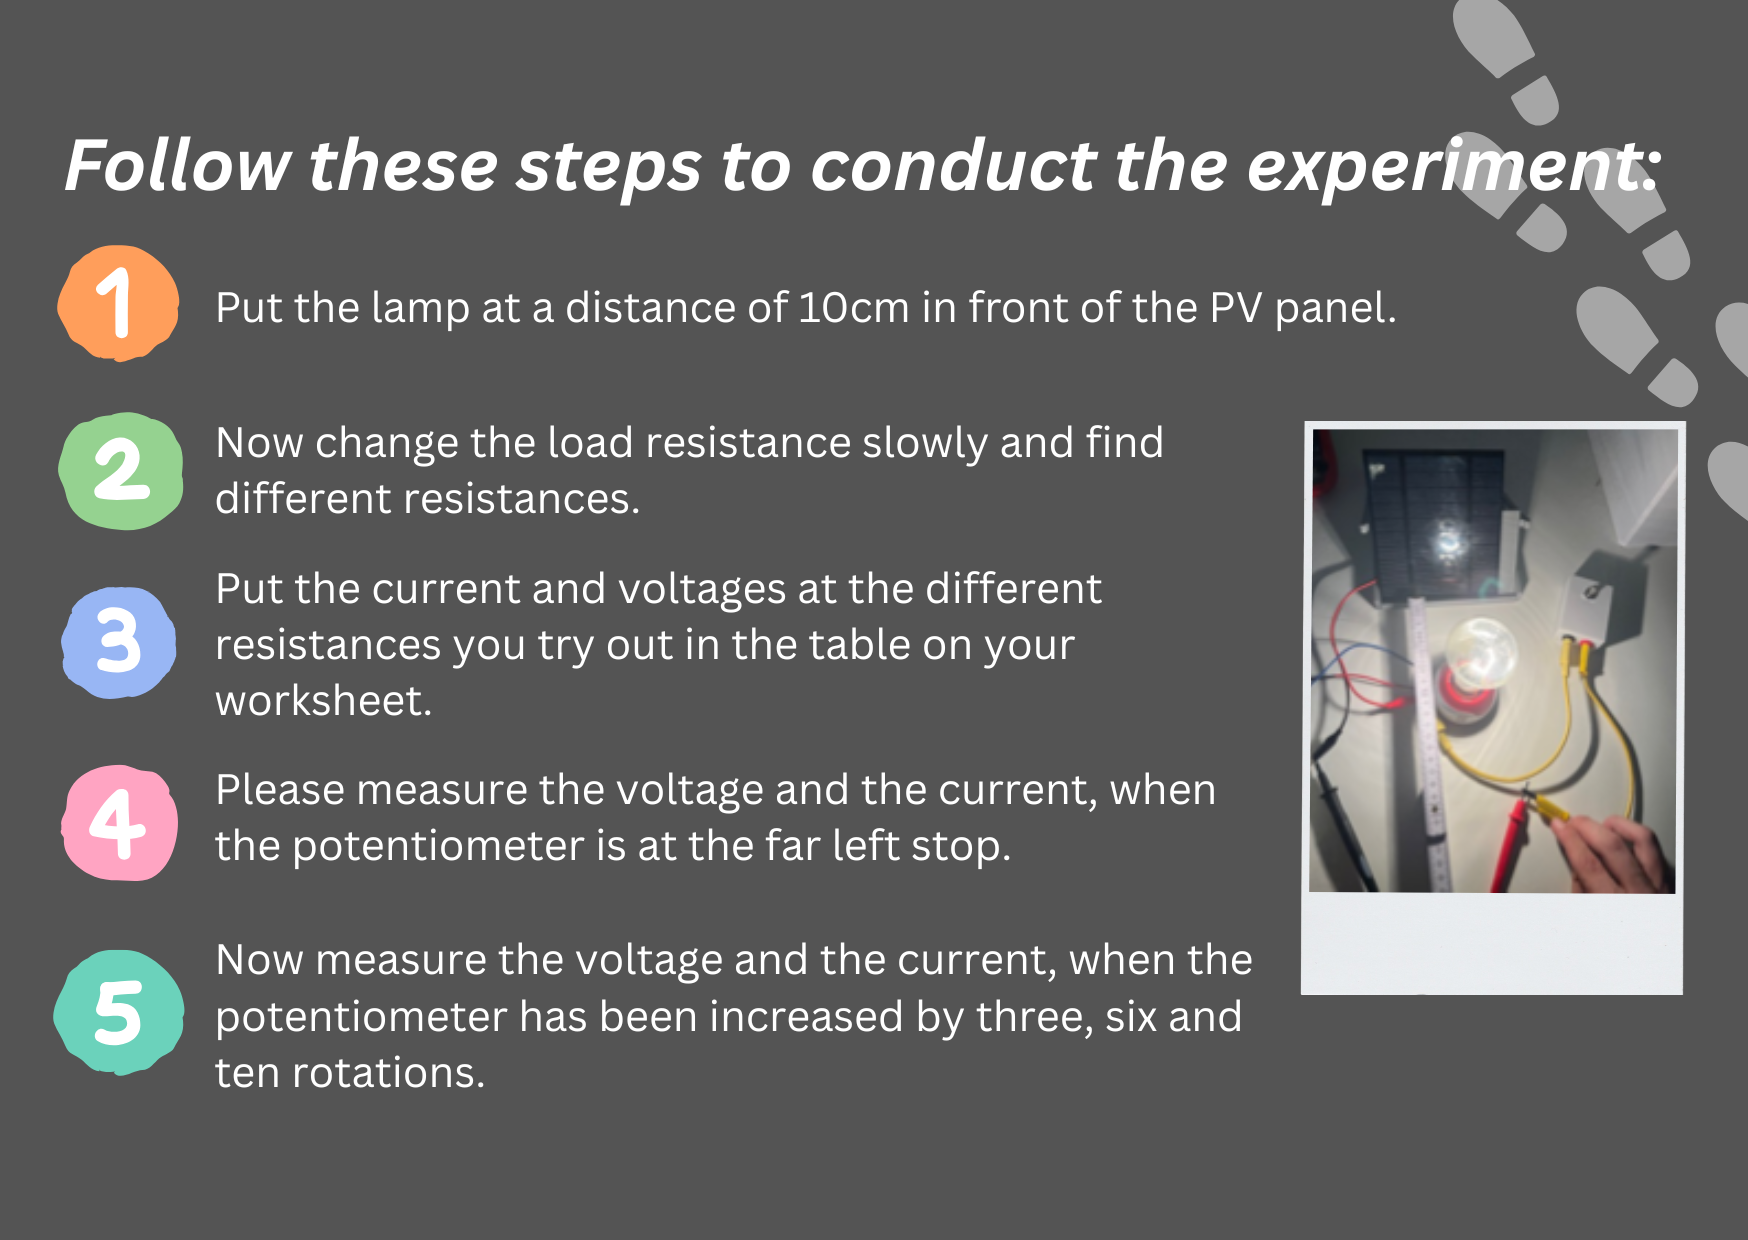
Plot the new points Pnew (U | I) in the graph you drew in the previous exercise!
💡 How does changing the resistance affect the operating point?
High Resistance (Open Circuit):
– Very low current
– Operating point at open-circuit voltage (Voc)
Low Resistance (Short Circuit):
– Very low voltage
– Operating point at short-circuit current (Isc)

Intermediate Resistance:
– Voltage and current depend on resistance
– Higher resistance → higher voltage, lower current
– Lower resistance → lower voltage, higher current

📝 Exercise
Task 1:
Plot the different points you measured into a graph.
Connect the dots to form a curve. Can you find a Maximum?

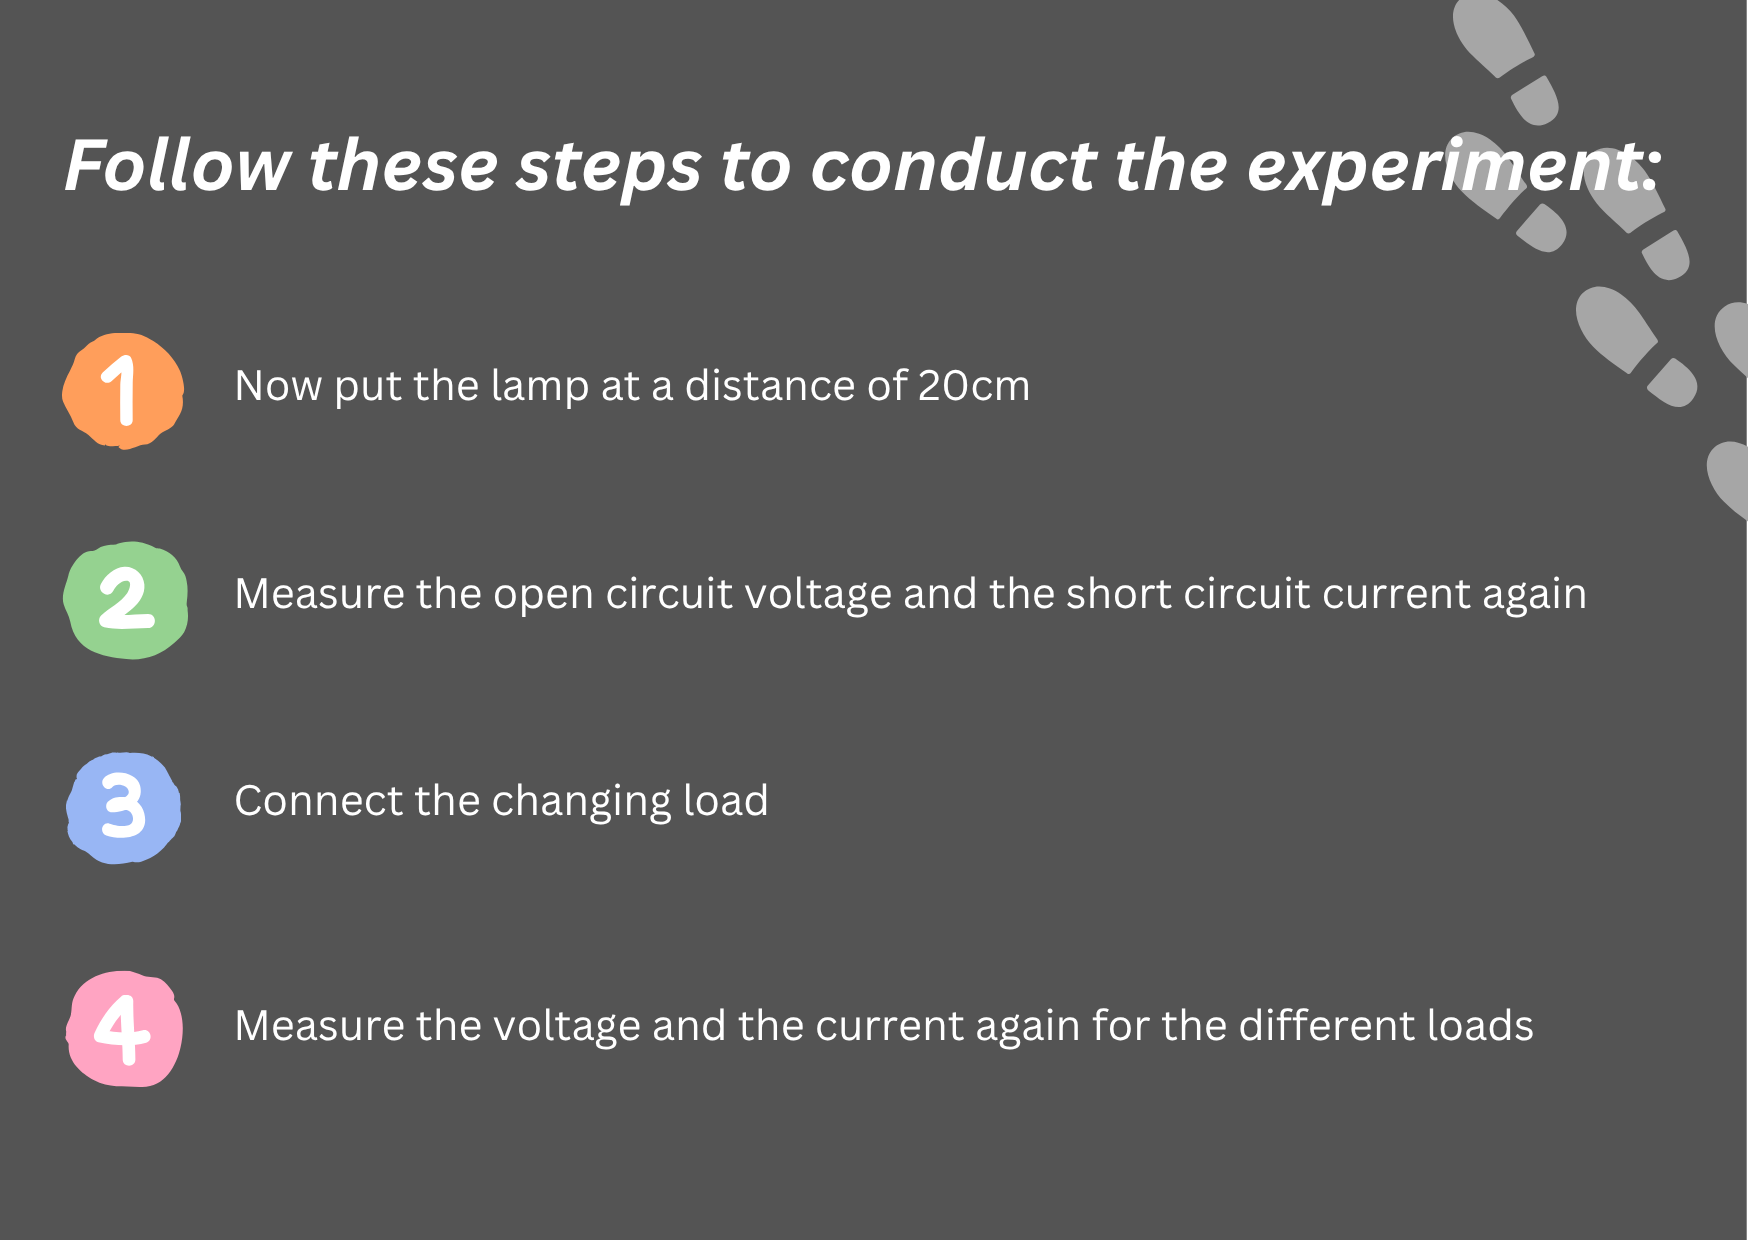
🌍 2.5 Local Conditions and Load Changes
This section explores how different environmental conditions (e.g., light, temperature) influence the operating point of a PV system when the load is varied.
🔬 Experiment
Materials needed:
- One lamp (yellow light bulb)
- PV modules (small or big)
- Multimeter
- Various cables
- Holder for PV panels
- Resistance (Potentiometer)
📝 Exercise
Task 1:
Replot your curve from section 2.4 and add the new curve from this experiment.
Task 2:
What changed compared to before? What happened to the maximum? Please discuss with your seat neighbor.
📗 Chapter 3 – Connecting PV to a Load and MPP
🔋 3.1 MPPT – Maximum Power Point Tracking
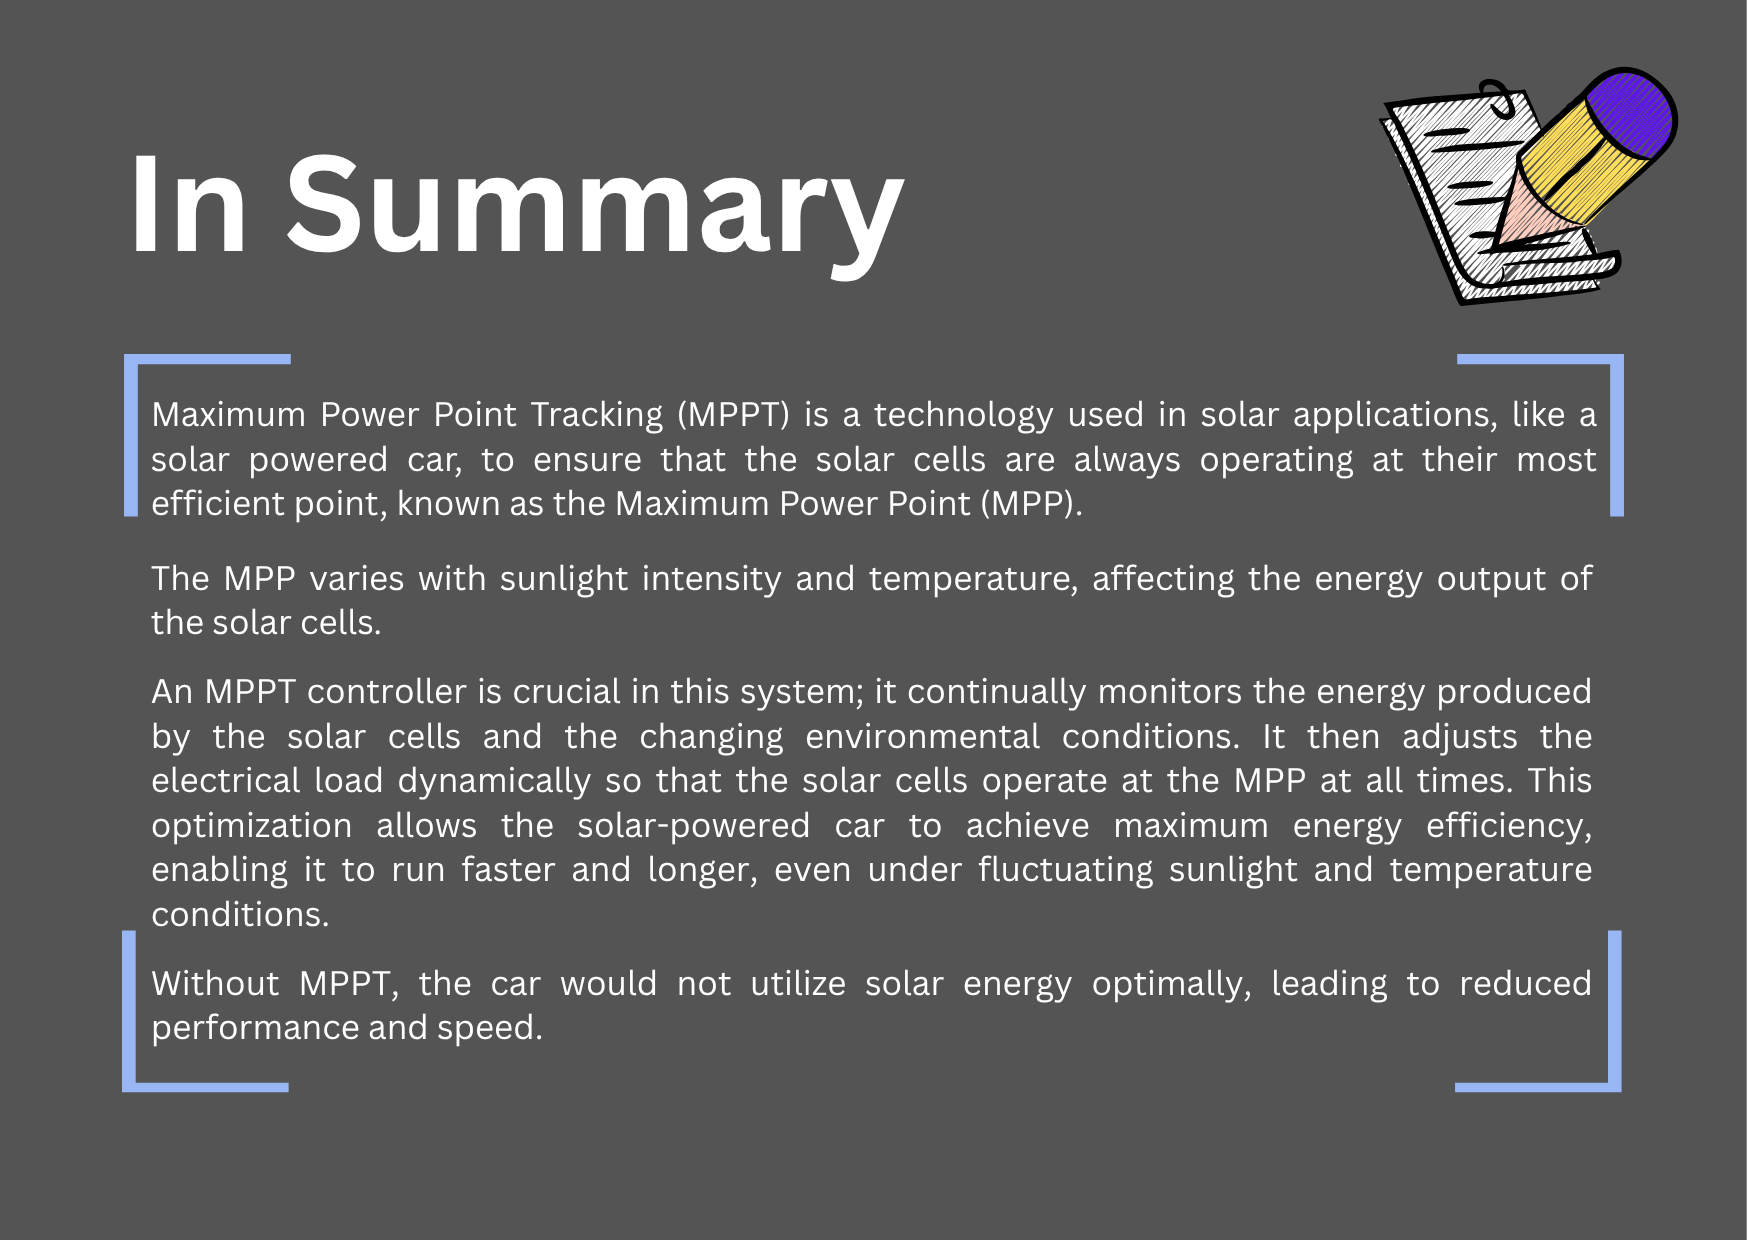
Imagine you have a toy car with a PV cell on the roof that is powered only by sunlight.

You know that it gets its energy from the sun through small solar cells on its roof. For the car to go as fast as possible, it needs to get just the right amount of energy from the sun all the time. But the amount of sunlight hitting the solar cells changes all the time – sometimes it’s very sunny, sometimes it’s cloudy, and sometimes the sun is in a different position in the sky.

MPPT, or Maximum Power Point Tracking, is like a very smart friend who makes sure your solar car always gets the best possible amount of energy, no matter how the sun is shining.

This smart friend constantly watches and adjusts things to make sure the car always gets the maximum power it can use.
Repetition:
As we have learned before, there are changing Sunlight Conditions: The amount of sunlight hitting the solar cells keeps changing. When it’s sunny, the solar cells produce more energy, and when it’s cloudy, they produce less. The temperature also affects how well the solar cells work – they perform differently when it’s hot compared to when it’s cool.
💬 Here’s how MPP works
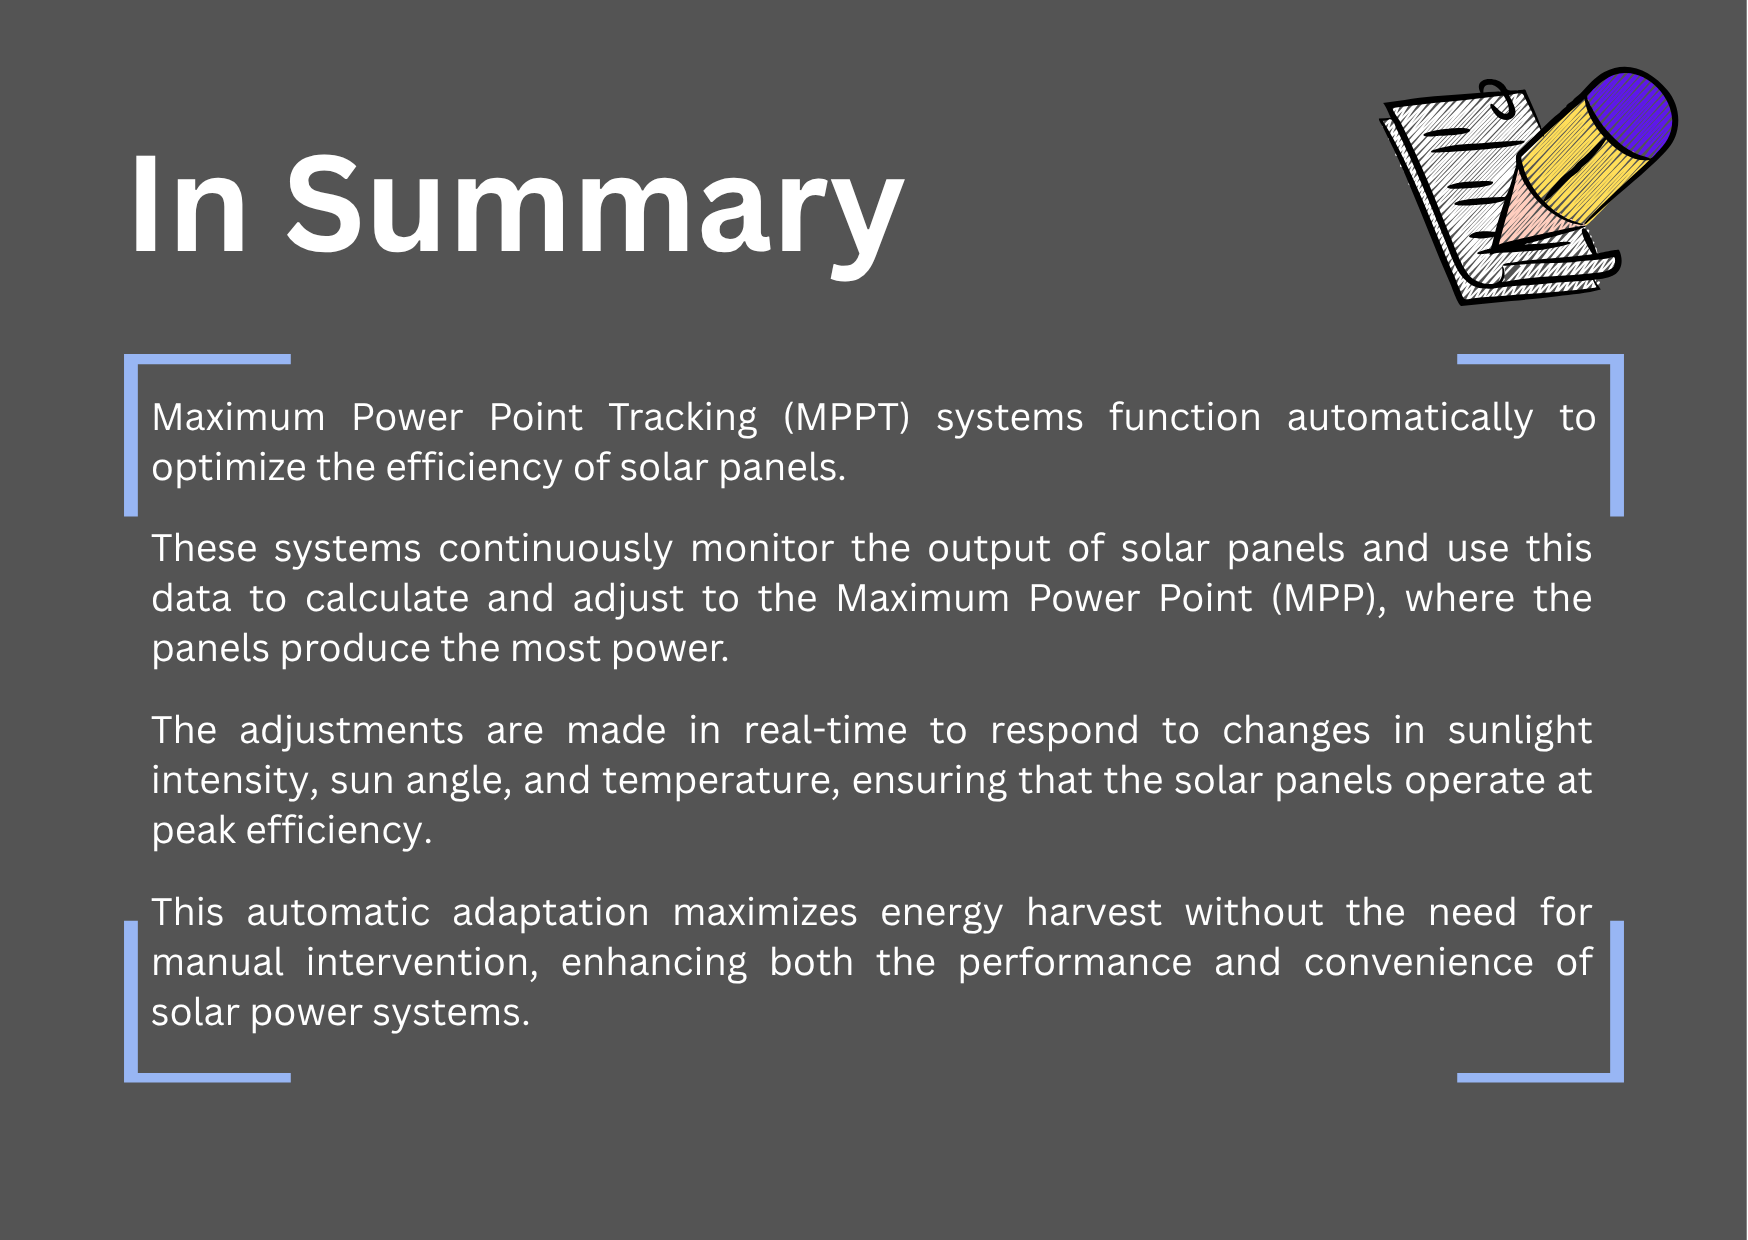
- Optimal Energy Use: Solar cells have a specific point where they produce the most energy. This point is called the Maximum Power Point (MPP).
- MPPT Controller: A device that adjusts the load to always operate at MPP despite changing conditions.
- Practical Benefit: Ensures devices like solar-powered cars always get maximum energy for best performance.
✅ Automatic MPP is needed!
🔬 Experiment
Connect the PV to the MPPT controller.
📝 Exercise
Task: What might be happening inside this MPPT controller? Please discuss this with your seat neighbor.
🛠️ 3.2 Controlling the MPPT
🔬 Experiment
Try to control the MPPT controller manually, as the load is changed.
📝 Exercise
- Task 1: What do you notice? How can the MPP direction be estimated? Discuss with your seat neighbor.
- Task 2: How can the MPP be tracked automatically? Switch the MPPT to automatic mode and observe.
- Task 3: What can you observe?
- Task 4: Switch the controller to pure PWM mode. Do you notice anything?
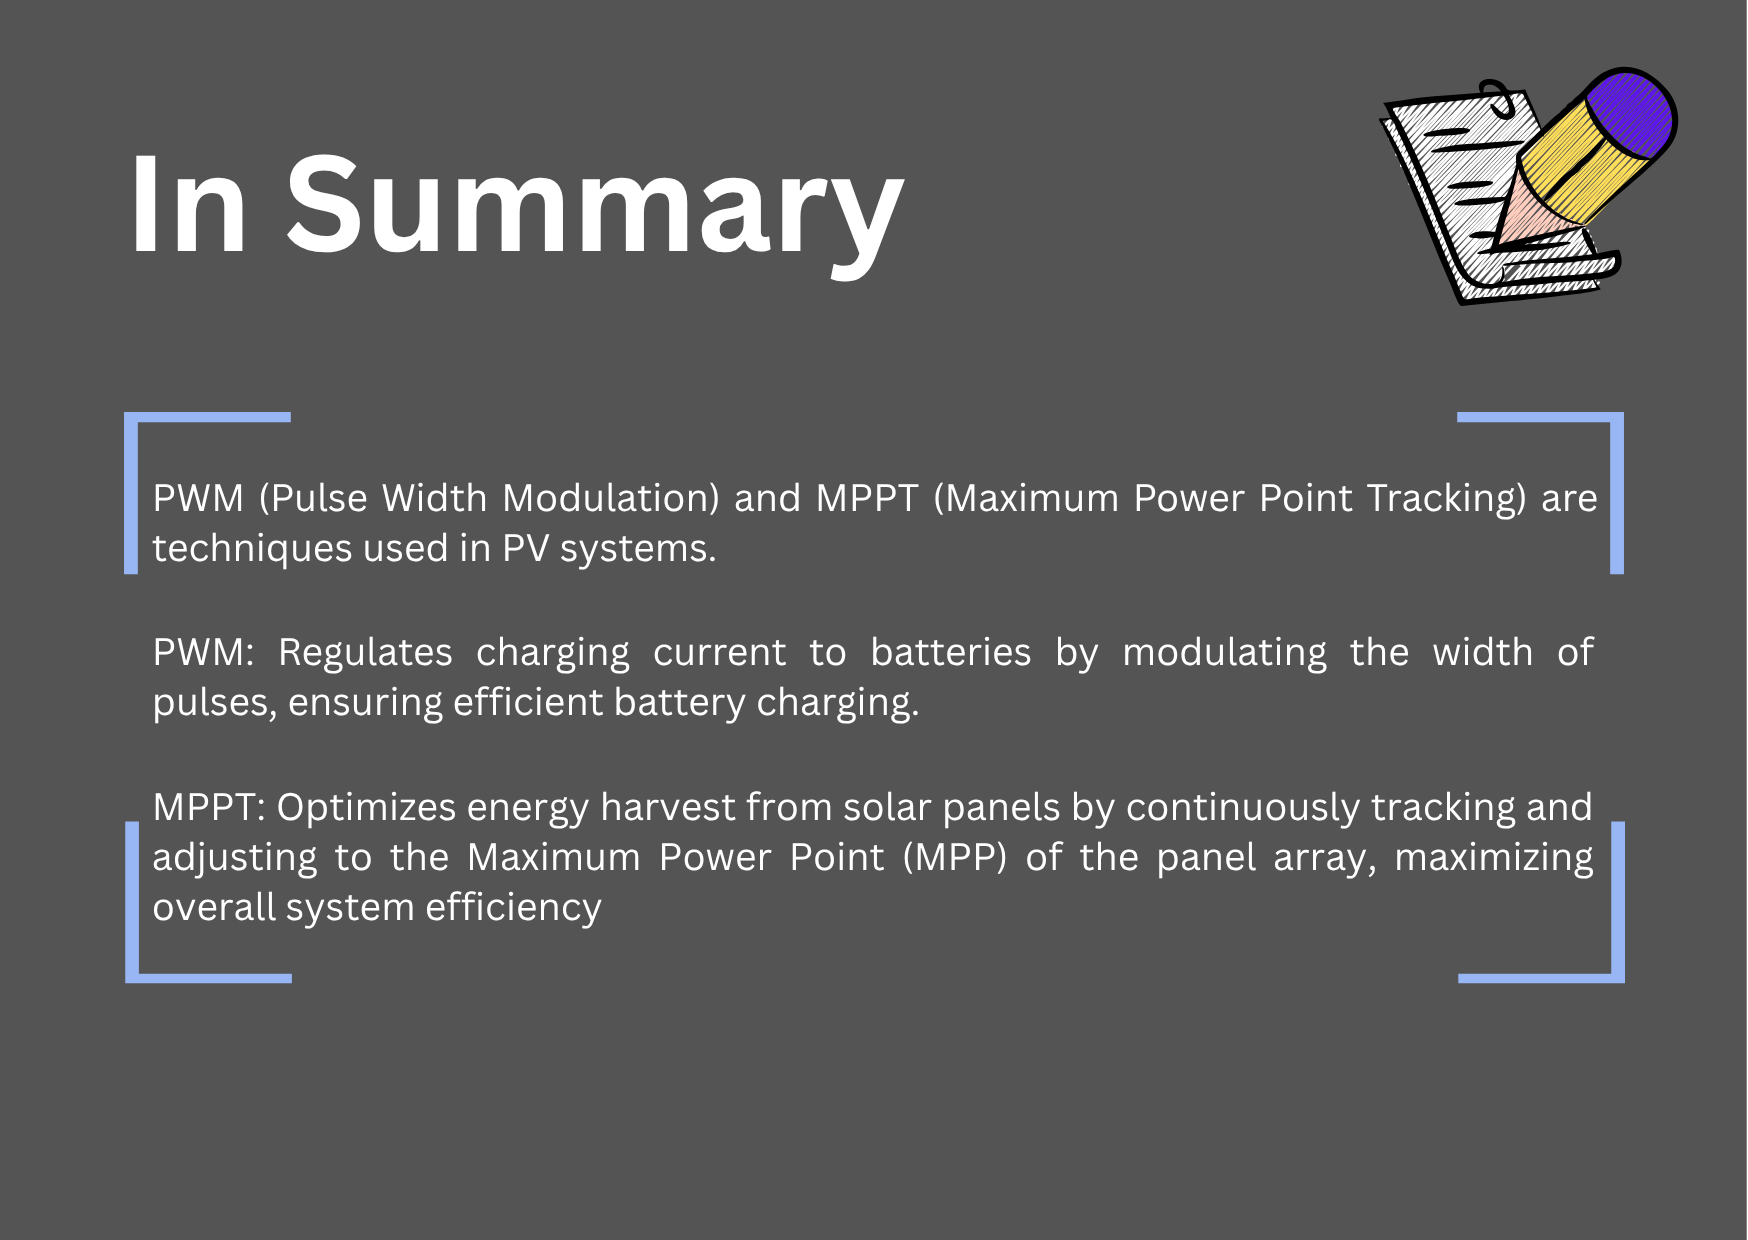
⚖️ 3.3 PWM vs. MPPT
📝 Exercise
Task: Which is better in your opinion: PWM or MPPT? Please consider both the benefits of each application and the costs.
🔍 Chapter 4 – Application: Analyzing Energy Consumption Profiles of Household Appliances
📘 In this exercise, you will learn about:
- Visualizing energy consumption profiles of household appliances
- Data analysis using Pivot Tables
- Analyzing different usage modes for specific appliances
- Calculating energy consumption and associated costs
- Evaluating photovoltaic (PV) system options for residential use
🎯 Learning Objective
- Develop and interpret energy consumption profiles for various household appliances.
- Conduct data analysis utilizing Pivot Tables to generate visual representations of energy consumption.
- Identify and associate energy consumption patterns with specific household appliances.
- Examine different usage modes and compute the total energy consumption of appliances.
- Analyze the influence of various PV system capacities on energy production and economic savings.
Materials you will need for this task:
- Excel file named “Exercise_Appliances”
- Computer with Excel software (Excel)
🔧 Task 1: Visualizing Energy Consumption Profiles of Household Appliances
📋 Initial Descriptions:
In this part you are given brief descriptions of the energy consumption profiles of four different household appliances. In the next section, you will be asked to create charts using Excel that visualize the actual energy consumption profiles of these devices. Then you will match the descriptions with the corresponding visuals. Here are the basic descriptions:
Washing Machine (WM):
- Multiple Peaks over the duration of operation
- High peaks during washing/heating cycles
- Relatively lower peaks for spinning cycles towards the end
Dishwasher (DW):
- Multiple Peaks over the duration of operation
- Peak level values of the spikes are generally close to each other
Kettle (K):
- Rapid and high spike in power usage
- Consistent power level during operation
Hair Dryer (HD):
- Rapid and high spike in power usage
- Depending on the operation mode it can have different peak values (The peak is lower than Kettle for the example)
- Consistent power level during operation
📊 Data Analysis and Visualization:
- Open the Excel file named Exercise_Appliances and navigate to the sheet named Task 1. Here you will find the combined datasets for the energy consumption profiles of 4 household appliances mentioned above.
- They are labeled as HA1 (HouseholdAppliance1), HA2, HA3, and HA4 in a random order.
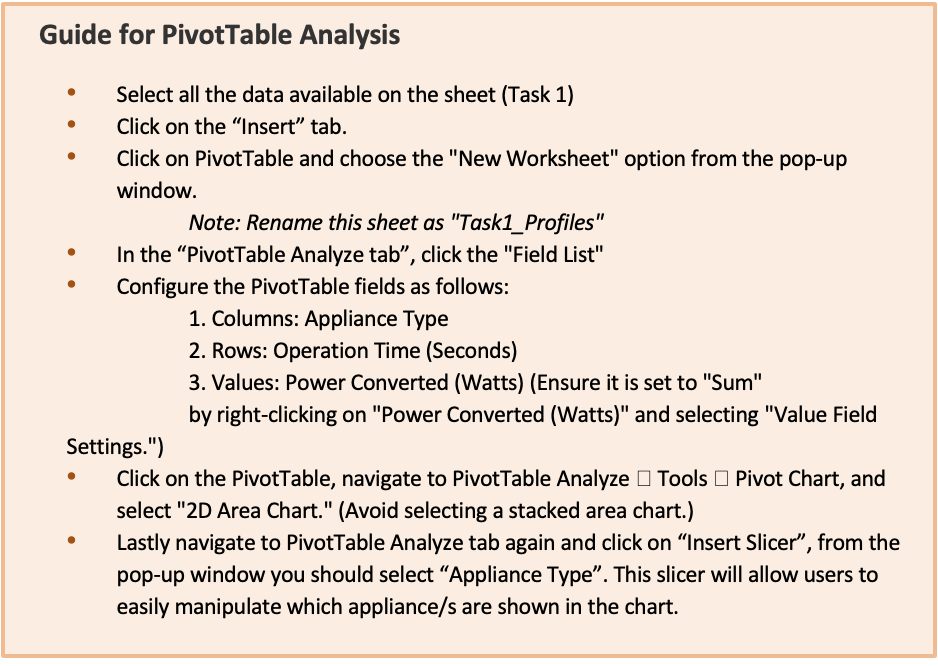
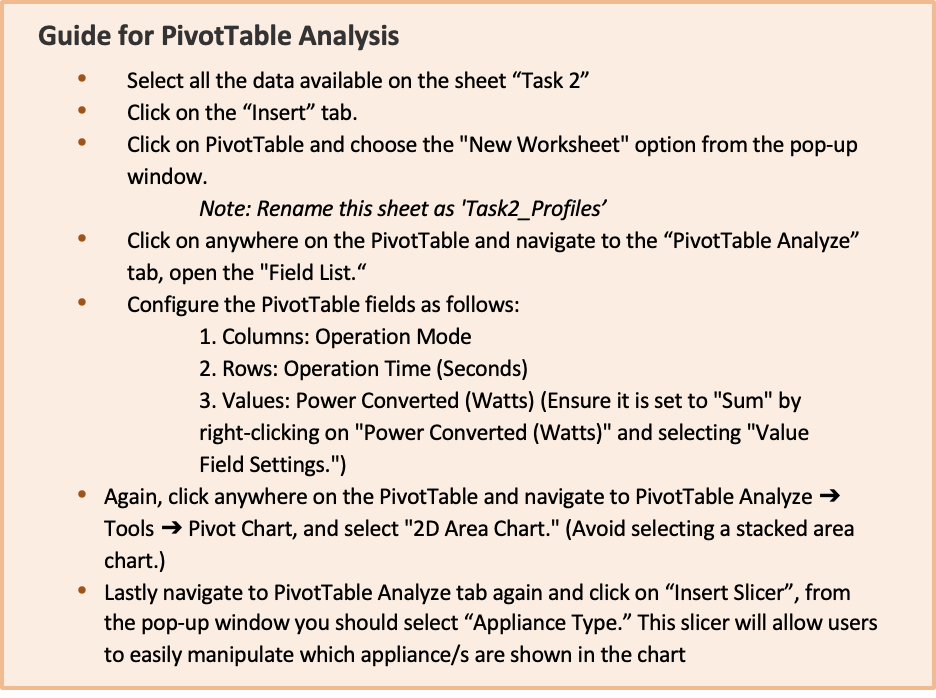
- Your task is to perform a Pivot Table Analysis to generate charts for each appliance.
- After creating the PivotTable charts, discuss and match the labels with the correct appliance names. Fill your answers in the boxes below.
| Household Appliance 1 (HA1) |
Household Appliance 2 (HA2) |
Household Appliance 3 (HA3) |
Household Appliance 4 (HA4) |
|---|---|---|---|
🧪 Task 2: Analyzing Different Usage Modes for the Kettle
📋 Initial Descriptions:
For Task 2 and Task 3, we will focus on a single appliance — the Kettle. Now navigate to the sheet named “Task 2” in the Excel file (Exercise_Appliances).
📊 Data Analysis and Visualization:
- Open the sheet named Task 2. You will find datasets for different usage modes of the Kettle.
- Six different usage modes are labeled ModeA to ModeF, representing amounts of water from 2 to 7 cups, in random order.
Note: 1 cup = 250 ml of water. - Create two Pivot Tables:
- One for visualizing the energy consumption profiles of each mode
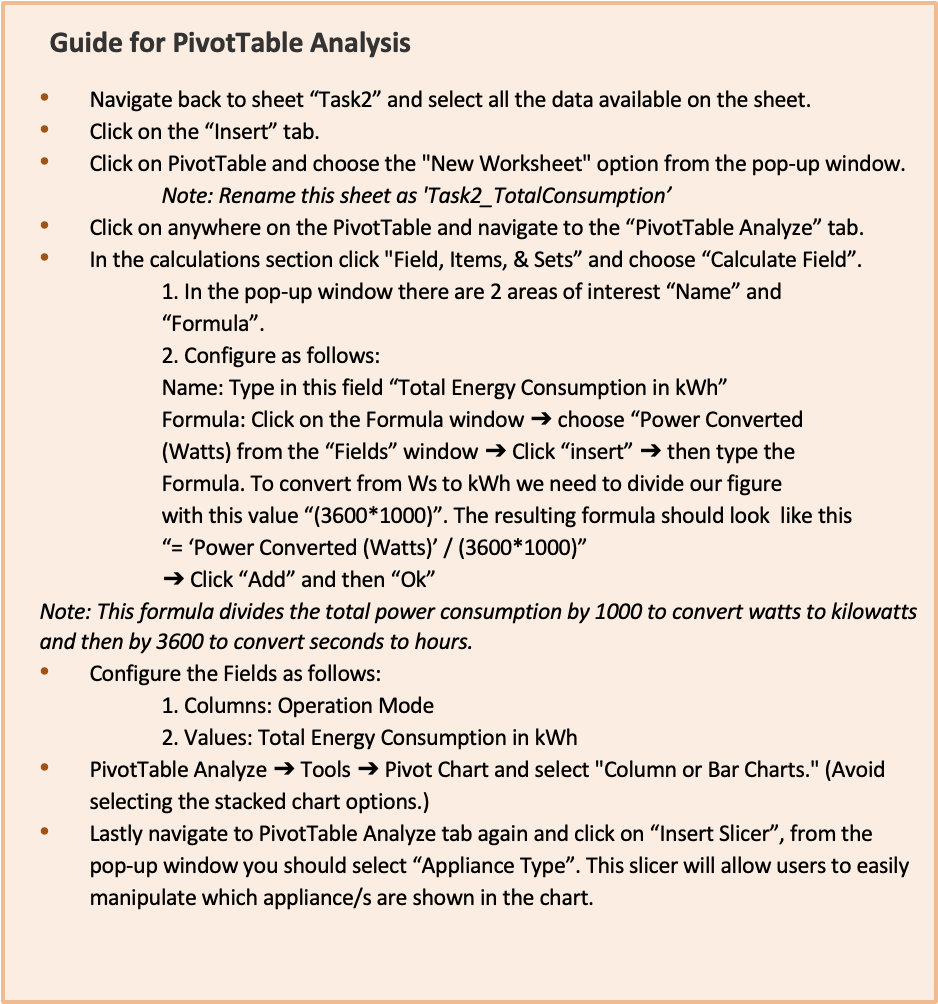
- Another for calculating the total energy consumption of each mode
📈 Energy Consumption Profiles:
Please identify how many cups of water were used for each mode (from 2 to 7 cups).
| Mode A | Mode B | Mode C | Mode D | Mode E | Mode F |
|---|---|---|---|---|---|
⚡ Total Energy Consumption:
Please fill in the total energy (in kWh) consumed by each mode (rounded to three decimal places).
| 2 Cups | 3 Cups | 4 Cups | 5 Cups | 6 Cups | 7 Cups |
|---|---|---|---|---|---|
🏠 Task 3: Practical Examples – Kettle
For the following exercises we will use the same Kettle and its data.
👪 Assumption:
Three user groups in different households use the same kettle. Their usage habits differ as follows:
- Household 1: Adds exactly 2 cups of excess water per use (if possible).
- Household 2: Adds exactly 1 cup of excess water per use (if possible).
- Household 3: Adds exactly the desired amount of water (no excess).
📘 Scenario 1
Each household uses the kettle 10 times a day. Actual needed amounts per day:
- 2 times: 3 cups
- 5 times: 4 cups
- 3 times: 5 cups
🧮 Exercise 1.1: Monthly Energy Consumption
Calculate the monthly total energy consumption (in kWh) of each household:
| Household 1 (monthly) | Household 2 (monthly) | Household 3 (monthly) |
|---|---|---|
💡 Exercise 1.2: Monthly Electric Bill
Using the electricity pricing info, calculate the electric bill for each household (in GHp):
- 0–30 kWh → 63.4792 GHp/kWh
- 31–300 kWh → 140.5722 GHp/kWh
- > 301 kWh → 185.7432 GHp/kWh
Assume base household consumption (excluding kettle) = 260 kWh/month
| Household 1 (Electric Bill) | Household 2 (Electric Bill) | Household 3 (Electric Bill) |
|---|---|---|
📘 Scenario 2
Daily kettle usage per household:
- Household 1: 9 times
- Household 2: 10 times
- Household 3: 12 times
Needed amounts:
- 5 times: 5 Cups
- Remaining times: 4 Cups
🧮 Exercise 2.1: Monthly Energy Consumption
Calculate the monthly energy consumption of each household:
| Household 1 (monthly) | Household 2 (monthly) | Household 3 (monthly) |
|---|---|---|
💡 Exercise 2.2: Monthly Electric Bill
Calculate the electric bill (GHp) for each household:
| Household 1 (Electric Bill) | Household 2 (Electric Bill) | Household 3 (Electric Bill) |
|---|---|---|
💨 Task 4: Practical Examples – Hair Dryer
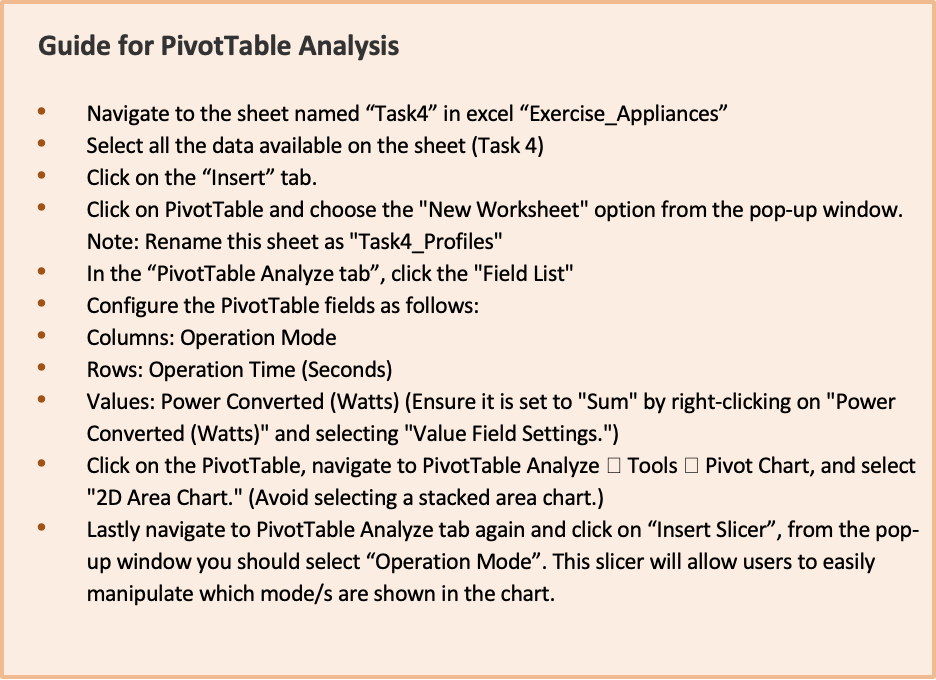
Your task is to use Pivot Table Analysis to generate charts for a hair dryer’s different operation modes and total energy consumption. This is the same hair dryer from Task 1.
📈 1. Energy Consumption Profiles
Use the chart below to assign labels to each mode. The hair dryer has:
- 3 different heat settings: High, Medium, Low
- 2 different fan speed settings: High, Low
This makes 6 possible configurations. All modes run for ~120 seconds, so duration isn’t a key factor in total energy use.
| Mode A | Mode B | Mode C | Mode D | Mode E | Mode F |
|---|---|---|---|---|---|
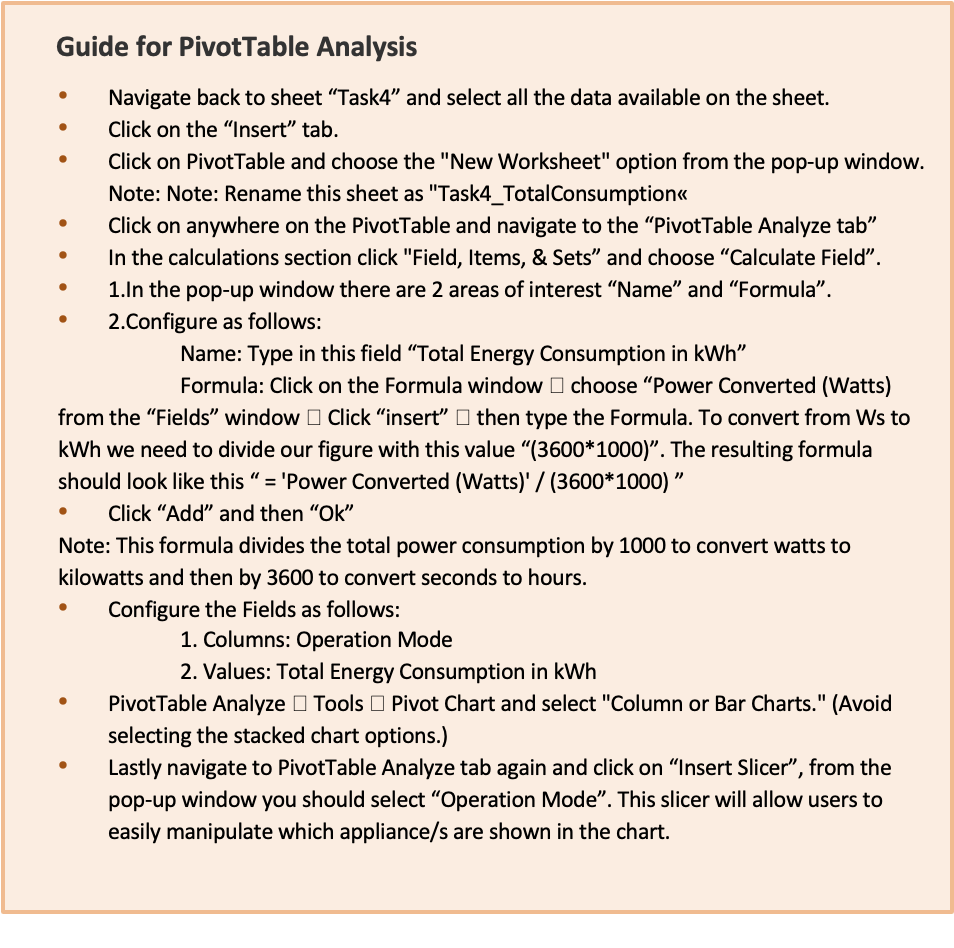
⚡ 2. Total Energy Consumption
Please enter the energy consumed (rounded to 3 decimal places) for each configuration:
| High Heat High Speed |
High Heat Low Speed |
Medium Heat High Speed |
Medium Heat Low Speed |
Low Heat High Speed |
Low Heat Low Speed |
|---|---|---|---|---|---|
👥 3. Daily Use Scenarios
Two households use the hair dryer 3 times daily with different usage habits:
Household 1:
- 4 min – High Heat, High Speed
- 2 min – High Heat, Low Speed
- 2 min – Medium Heat, Low Speed
Household 2:
- 2 min – Medium Heat, High Speed
- 6 min – Medium Heat, Low Speed
🔋 Task 5: Evaluating the PV System Options for Residential Use
📚 Background Information
1. PV System Capacity
A 10 kW PV system can provide up to 10 kW of power under optimal conditions (ideal sunlight, angle, temperature). If your devices need more power than the system can provide, this can lead to underperformance or shutdowns.
2. Energy Production Estimates
Assuming 4–6 hours of peak sunlight per day:
- 10 kW × 4 hours = 40 kWh/day (lower estimate)
- 10 kW × 6 hours = 60 kWh/day (higher estimate)
3. Managing Power Consumption
- Battery Storage: Stores excess energy for later use.
- Grid Connection: Covers demand when solar energy isn’t enough.
Demand Side Management Strategies:
- Stagger high-power appliance usage
- Use energy-efficient appliances
- Implement smart home tech for better control and distribution
1. Comparison of Two Households with/without Demand Side Management (DSM)
Create charts with the provided dataset (12:00–14:00) and compare:
Household with DSM
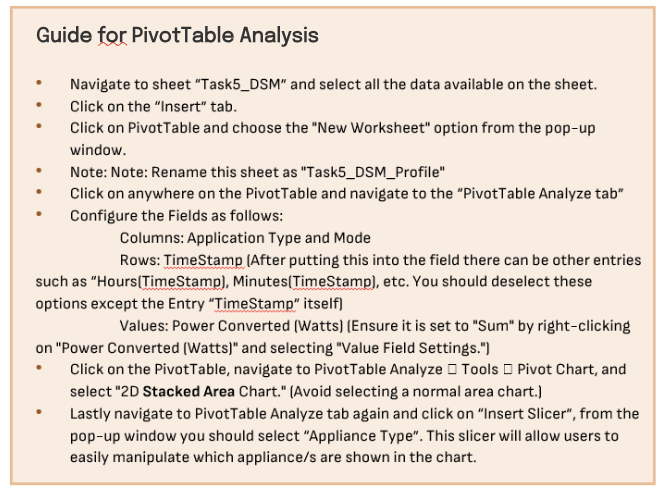
Household without DSM
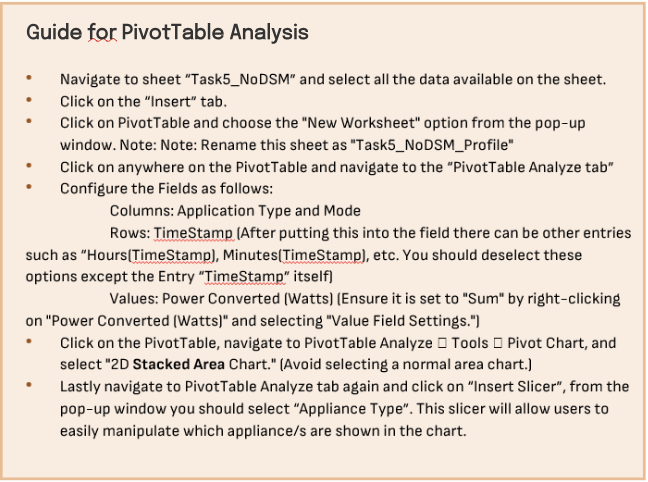
Fill in the peak consumption values and discuss possible implications of these peaks.
2. PV System Options (Ideal Conditions)
- System A: 3 kW – $4,000
- System B: 5 kW – $6,000
- System C: 10 kW – $10,000
Assume the non-DSM household peaks at 9999 W and consumes ~400 kWh monthly.
Exchange rate: 1 USD = 15.36 GH₵ = 1536 GHp
2.1 Energy Production and Cost Savings
Accra average sunlight: 6h 30min daily (~2377 hours/year)
- Lower estimate: 4h 30min/day
- Higher estimate: 8h/day
Use these to calculate monthly energy production and cost savings using Ghana’s electricity prices from Task 3.
2.2 Investment Cost and Payback Period
Calculate how long it would take each system to pay for itself based on monthly savings.
Then recommend the best option for each household based on their usage profile.
3. PV System Options (Real-Life Conditions)
Assume 75% efficiency due to real-world factors. Recalculate energy production and cost savings as above.
3.1 Energy Production and Cost Savings
- Use 75% of ideal daily output
- Repeat monthly calculations
3.2 Investment Cost and Payback Period
Repeat payback calculations under realistic efficiency. Decide which system is most suitable for each household.